 English
  Русский
 Bahasa Indonesia
 Bahasa Malay
 ไทย
ไทย Español
 Deutsch
 Български
 Français
 Tiếng Việt
 中文
中文 বাংলা
বাংলা हिन्दी
 Čeština
 Українська
 Română

Overview:
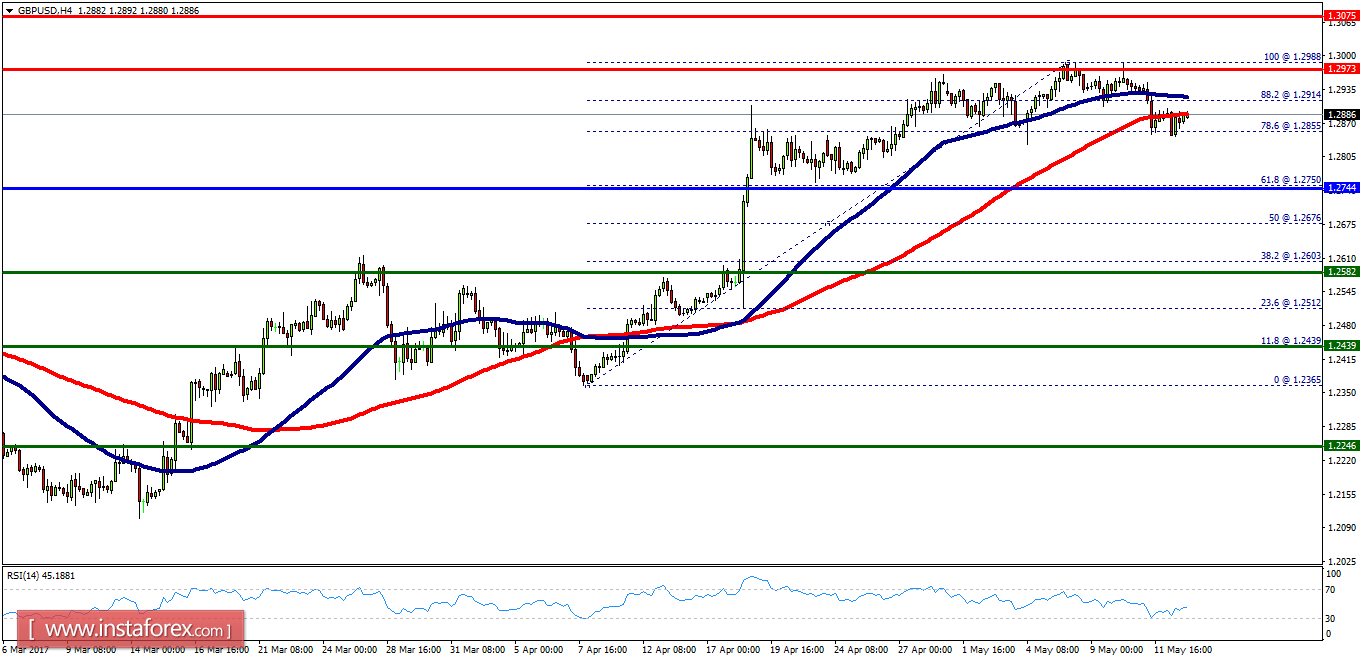
- The GBP/USD pair faced strong resistance at the level of 1.2973 because the double top is set around the spot of 1.2986.
- So, the strong resistance has already formed at the level of 1.2973 and the pair is likely to try to approach it in order to test it again.
- However, if the pair fails to pass through the level of 1.2973, the market will indicate a bearish opportunity below the new strong resistance level of 1.2973.
- Moreover, the RSI starts signaling a downward trend, as the trend is still showing strength above the moving average (100) and (50).
- Thus, the market is indicating a bearish opportunity below 1.2973 so it will be good to sell at 1.2973 with the first target at 1.2744 (pivot).
- It will also call for a downtrend in order to continue towards 1.2582. The daily strong support is seen at 1.2582.
- On the contrary, the stop loss should always be taken into account, for that it will be reasonable to set your stop loss at the level of 1.3175 (major resistance).