 English
  Русский
 Bahasa Indonesia
 Bahasa Malay
 ไทย
ไทย Español
 Deutsch
 Български
 Français
 Tiếng Việt
 中文
中文 বাংলা
বাংলা हिन्दी
 Čeština
 Українська
 Română

Gold price is trading in a neutral zone inside the 4-hour Kumo. Trend has changed to neutral and price has bounced as we expected from the support area of $1,210-20.
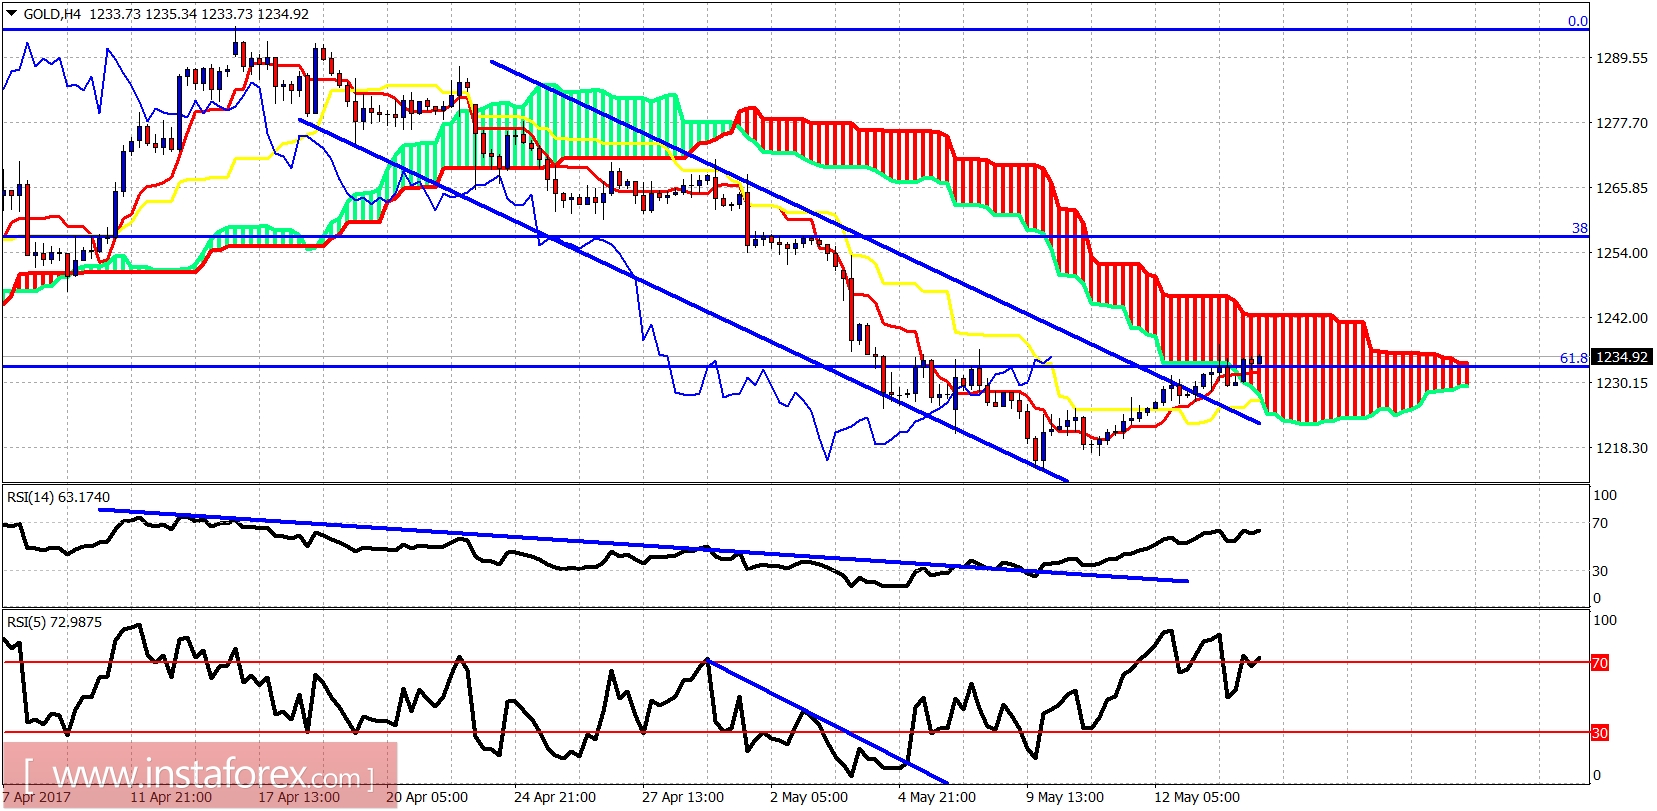
Gold price has broken out of the bearish channel. Short-term resistance is at $1,242 and next at $1,250-60. As long as the metal is trading below the $1,260 level, we could get rejected very well and push to new lows below $1,200 or even below $1,180.
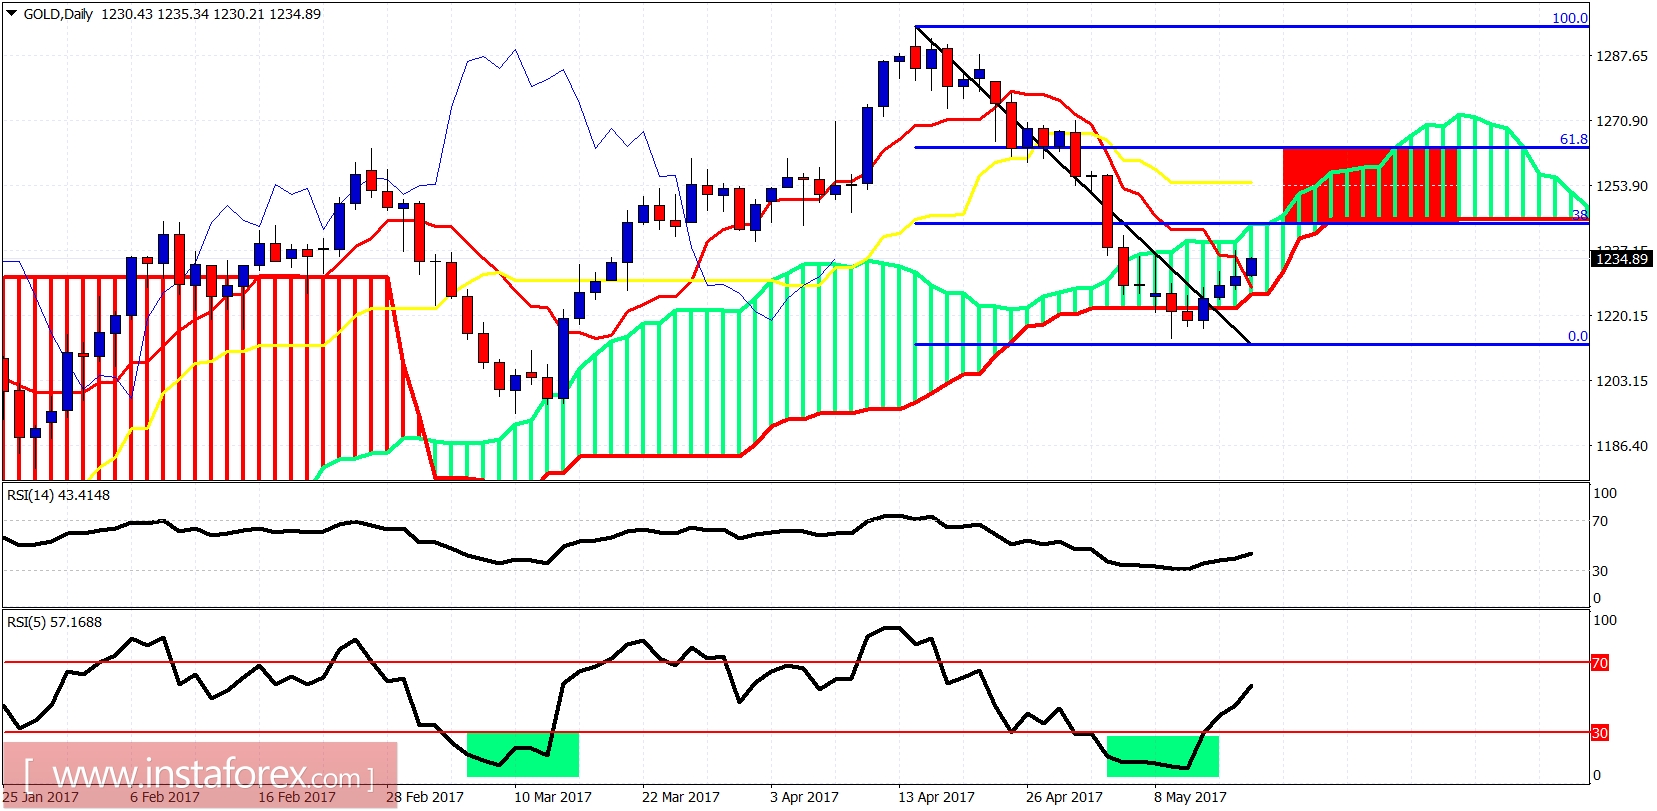
Gold price is bouncing as expected and we foresee a move towards the 50% and 61.8% Fibonacci retracement area where the red rectangle is found and the daily Kumo as well. Price should break this resistance for a push above $1,300. Otherwise, we are in danger of breaking below $1,200.