Gold price as expected is pulling back from the important weekly resistance at $1,260. Bulls now we need to see a higher low relative to the May lows at $1,214. A corrective pullback that will not hurt the bullish scenario should hold above $1,234.
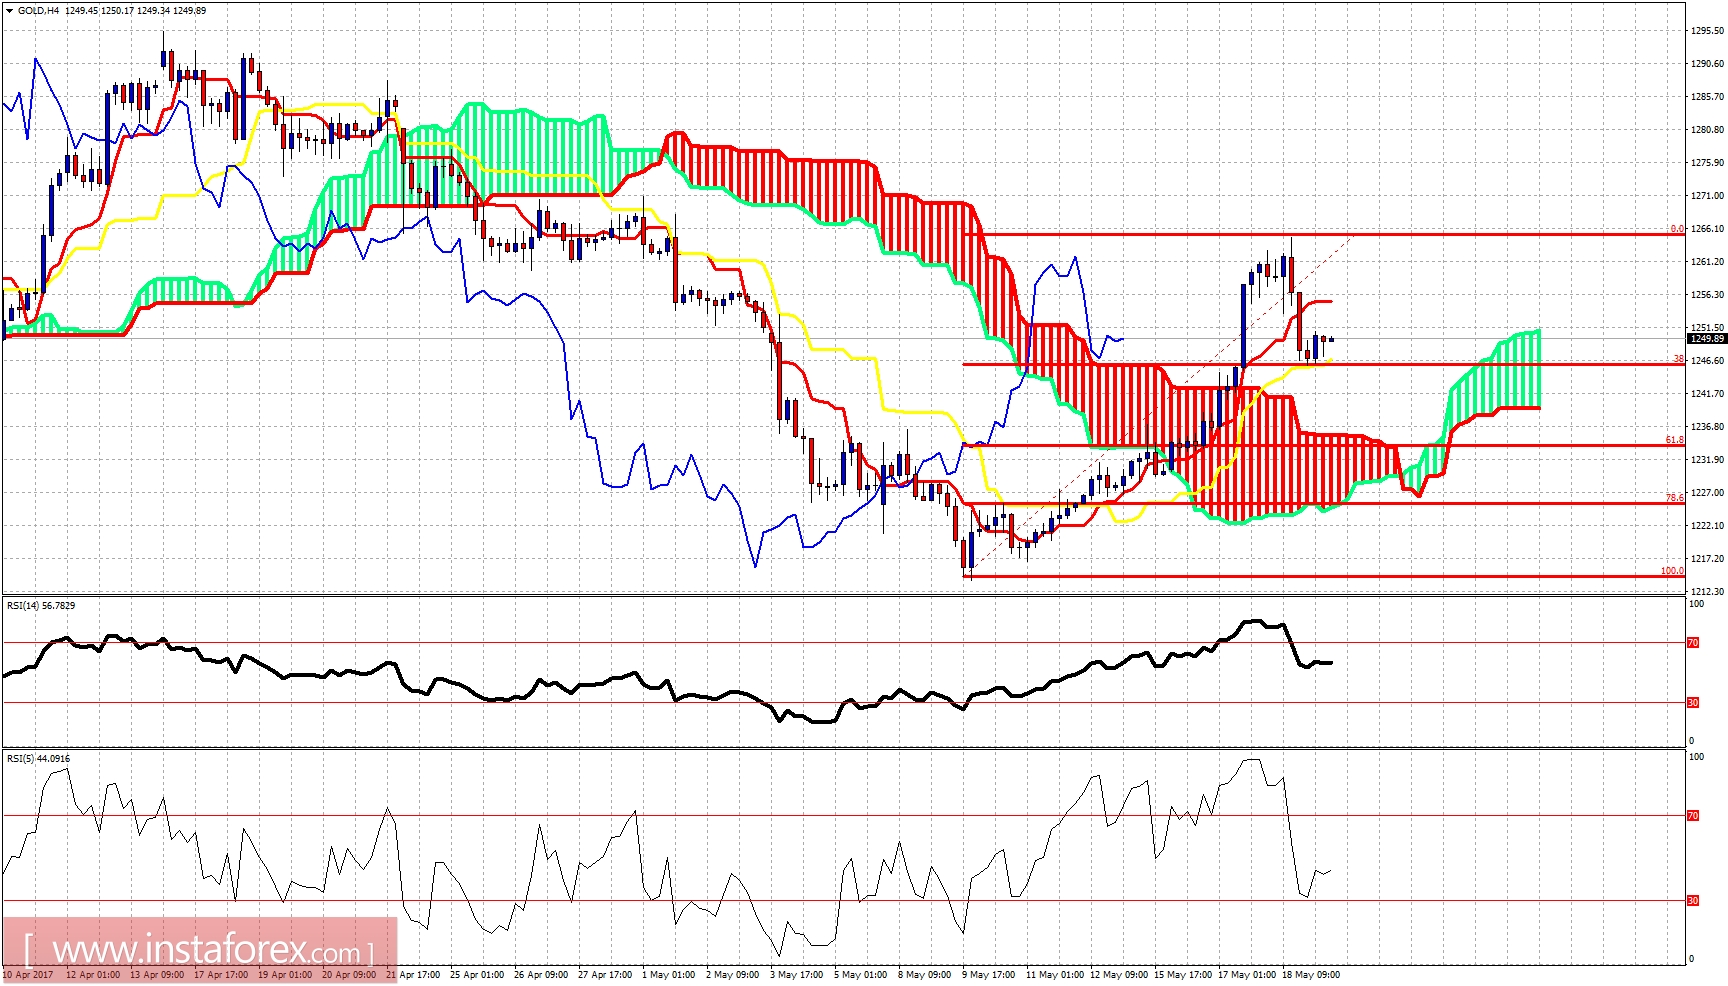
Gold price is trading above the 4-hour cloud. Trend is bullish. Gold price could bounce from current levels as price has found support at the 38% Fibonacci retracement of the rise from $1,214. Next important support is at $1,234 where the 61.8% and the cloud supports are found. Bulls should not lose that level. On the other hand bears stopped the rise right at the important resistance of $1,260. Now they need to break back below the cloud for the move towards $1,150-60 to start.
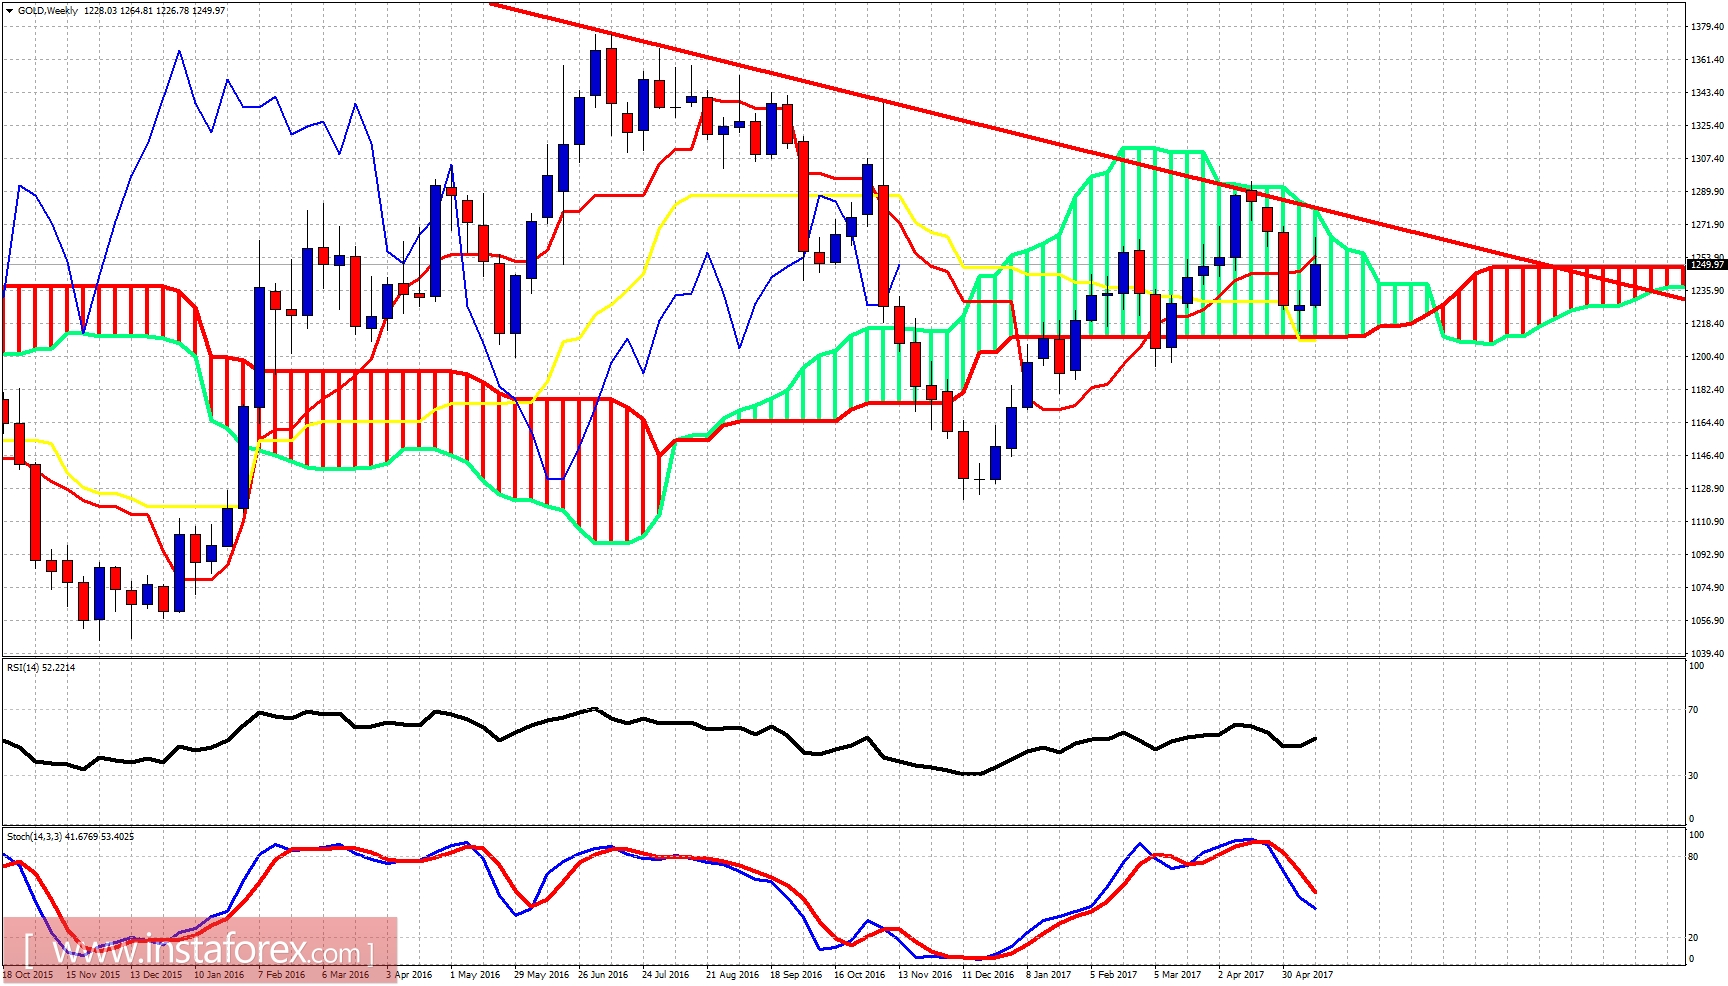
Red line -long-term resistance
Gold remains inside the weekly Kumo (cloud). Weekly trend remains neutral. Price remains below the weekly trend line resistance. However the bounce off the lower cloud boundary was a bullish sign. Bulls however need to break above the weekly cloud at $1,280 for the bull trend to be confirmed.
*The market analysis posted here is meant to increase your awareness, but not to give instructions to make a trade
 English
  Русский
 Bahasa Indonesia
 Bahasa Malay
 ไทย
ไทย Español
 Deutsch
 Български
 Français
 Tiếng Việt
 中文
中文 বাংলা
বাংলা हिन्दी
 Čeština
 Українська
 Română
