 English
  Русский
 Bahasa Indonesia
 Bahasa Malay
 ไทย
ไทย Español
 Deutsch
 Български
 Français
 Tiếng Việt
 中文
中文 বাংলা
বাংলা हिन्दी
 Čeština
 Українська
 Română

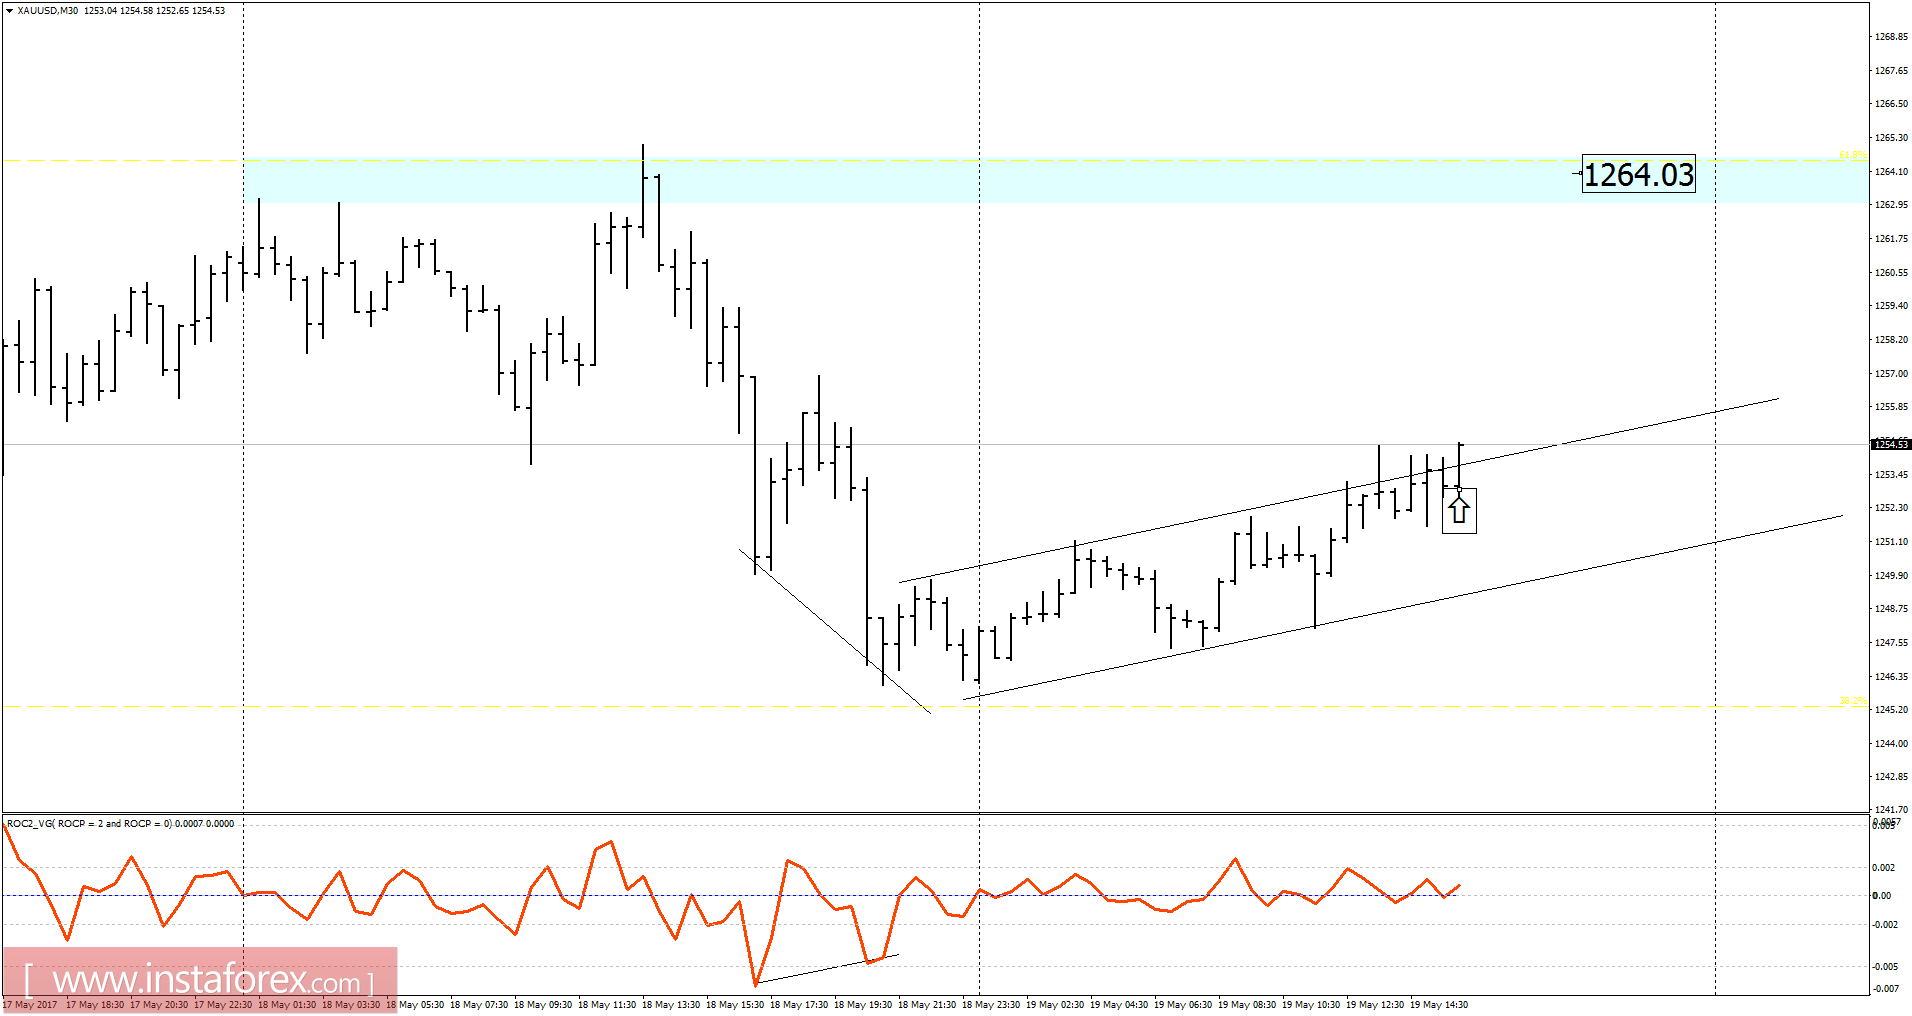
Recently, Gold has been trading downwards. The price tested the level of $1,246.00. According to the 30M time frame, there is a fake breakout of yesterday's low, which is a sign that sellers lost downward pressure. There is also a hidden bullish divergence on the ROC oscilator, which is another sign of strength. My advice is to watch for buying opportunities. The upward target is set at the price of $1,264.00.
Resistance levels:
R1: $1,261.90
R2: $1,266.45
R3: $1,273.80
Support levels:
S1: $1,247.00
S2: $1,242.00
S3: $1,235.00
Trading recommendations for today: watch for potential buying opportunities.