 English
  Русский
 Bahasa Indonesia
 Bahasa Malay
 ไทย
ไทย Español
 Deutsch
 Български
 Français
 Tiếng Việt
 中文
中文 বাংলা
বাংলা हिन्दी
 Čeština
 Українська
 Română

The Dollar index is oversold, diverging and is expected to move higher this week towards at least 99 - 99.50. Price is expected to reverse upwards this week so I prefer to be Dollar bullish. Price is at important weekly support.
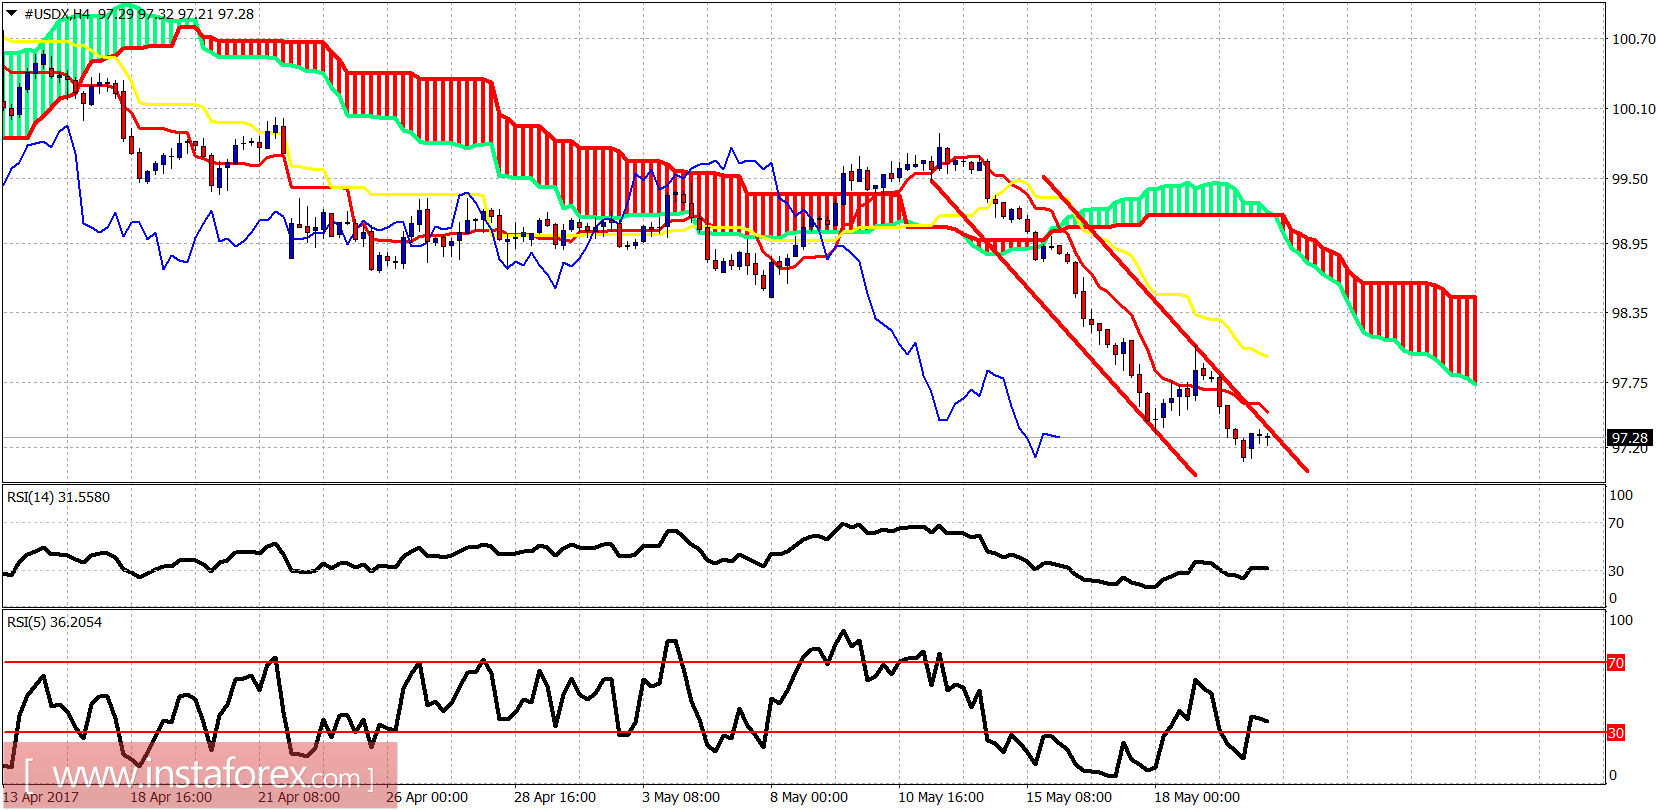
The short-term trend remains bearish as price is inside the bearish red channel and price below both the tenkan- and kijun-sen. I expect the Dollar index to bounce at least towards the Kumo (cloud) at 99.
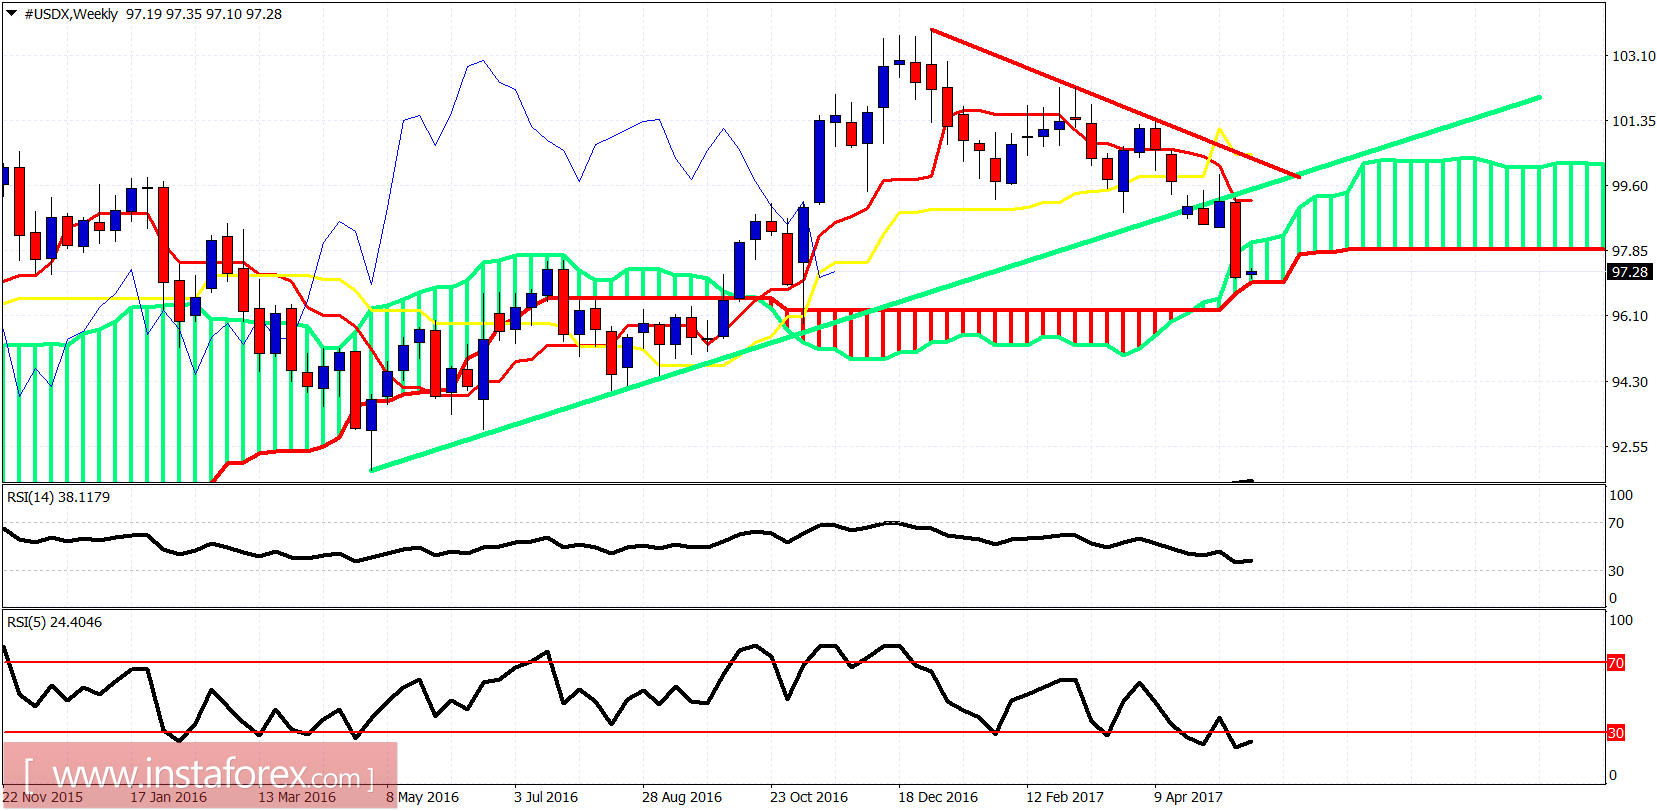
Green line - long-term trend line support (broken)
The Dollar index is at the weekly Kumo. Trend is about to turn bearish with price having broken the long-term trend line support. In the short-term, I expect a strong bullish reversal as the RSI (5) is oversold and about to turn higher. Price at the weekly Kumo should at least make a technical reflex bounce to 99. So I would wait for a bounce higher before re-entering short Dollar positions.