 English
  Русский
 Bahasa Indonesia
 Bahasa Malay
 ไทย
ไทย Español
 Deutsch
 Български
 Français
 Tiếng Việt
 中文
中文 বাংলা
বাংলা हिन्दी
 Čeština
 Українська
 Română

The index is trying to recover from its recent losses and it's testing now the resistance zone of 97.41. A breakout over there can open the doors for another rally towards the 98.11 area, which is slightly above the 200 SMA. To the downside, the support level of 96.90 continues to be a solid demand area, which should give up for a decline to test the 96.25 level.
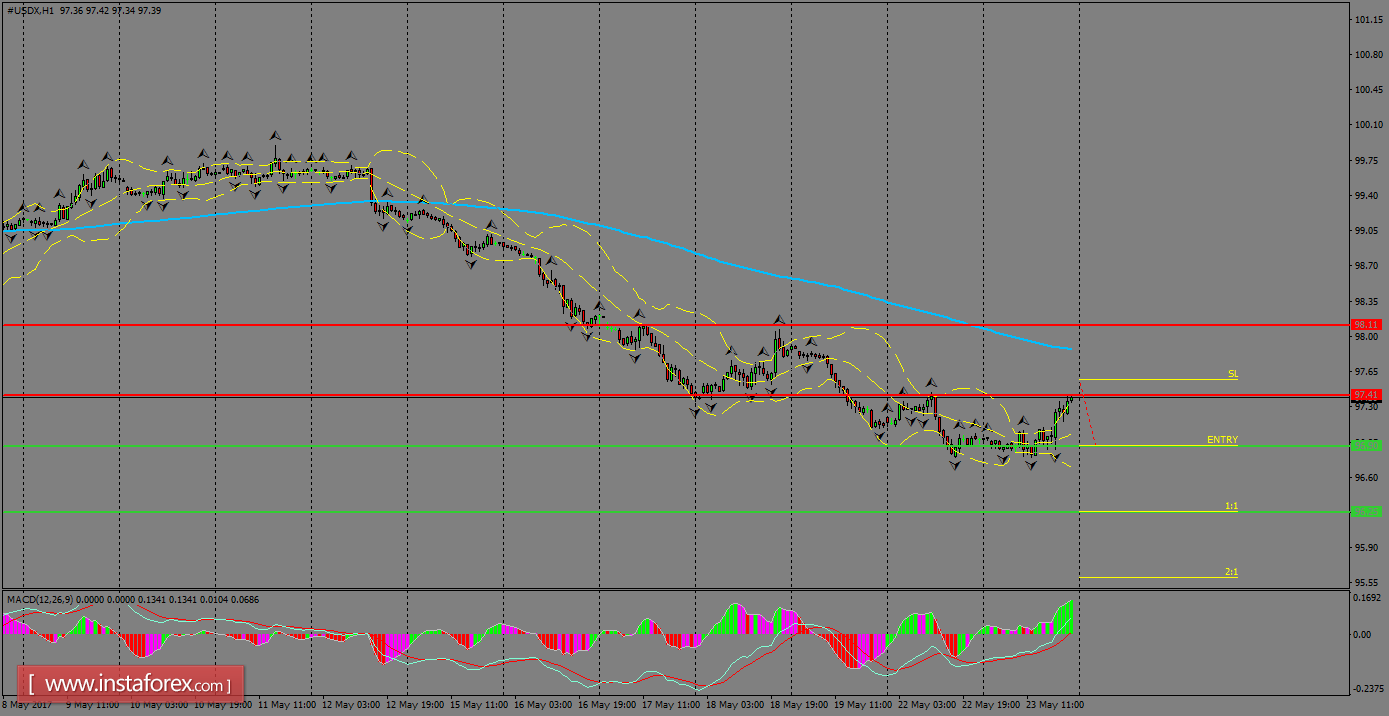
H1 chart's resistance levels: 97.41 / 98.11
H1 chart's support levels: 96.90 / 96.25
Trading recommendations for today: Based on the H1 chart, place sell (short) orders only if the USD Index breaks with a bearish candlestick; the support level is at 96.90, take profit is at 96.25 and stop loss is at 97.56.