 English
  Русский
 Bahasa Indonesia
 Bahasa Malay
 ไทย
ไทย Español
 Deutsch
 Български
 Français
 Tiếng Việt
 中文
中文 বাংলা
বাংলা हिन्दी
 Čeština
 Українська
 Română

Gold price is forming a sideways triangle price action. This tightening range will soon provide a break out and a clear signal. I believe that it is more probable the breakout to be to the upside.
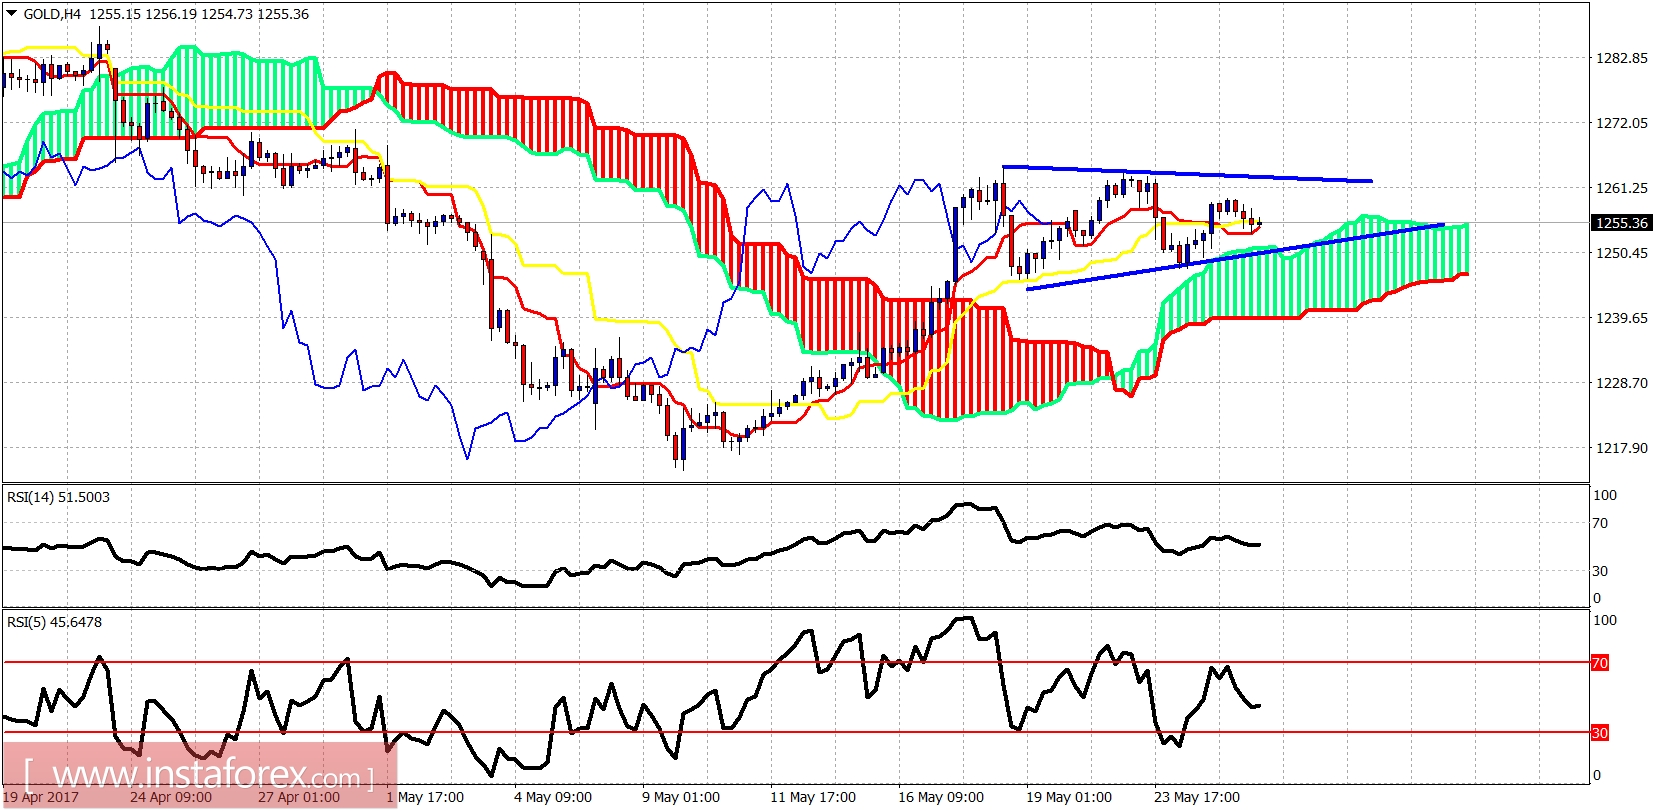
Gold price is trading around the tenkan- and kijun-sen indicators above the 4-hour Ichimoku cloud. Trend is neutral in the short term. Resistance is at $1,263. Support is at $1,250.
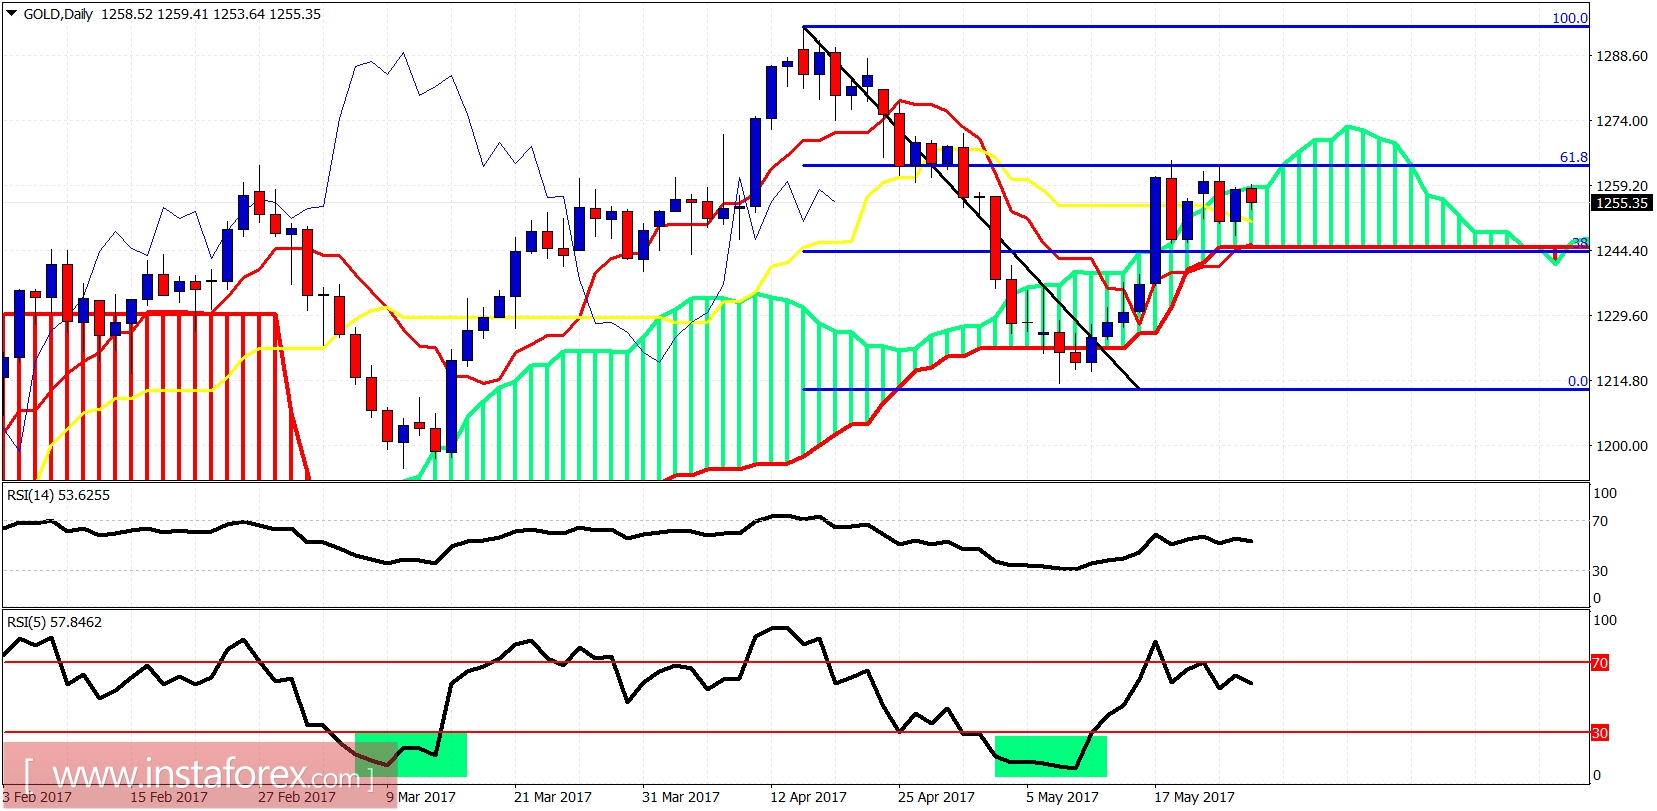
in a row. Price is near the upper cloud boundary and a daily close above it will be a bullish sign that will push price towards $1,280-$1,300. A close below $1,245 will be a bearish sign as price will be below the daily cloud.