 English
  Русский
 Bahasa Indonesia
 Bahasa Malay
 ไทย
ไทย Español
 Deutsch
 Български
 Français
 Tiếng Việt
 中文
中文 বাংলা
বাংলা हिन्दी
 Čeština
 Українська
 Română

USDX was favored by a bullish momentum witnesses during Friday's session and the resistance level of 97.41 is helping to cap the bulls. Also, the 200 SMA is acting as dynamic resistance and we can expect that it continues to be a barrier for the buyers. However, if the index manages to pull back at the current stage, then it can plummet towards 96.90, which is the critical zone to pay attention during this week.
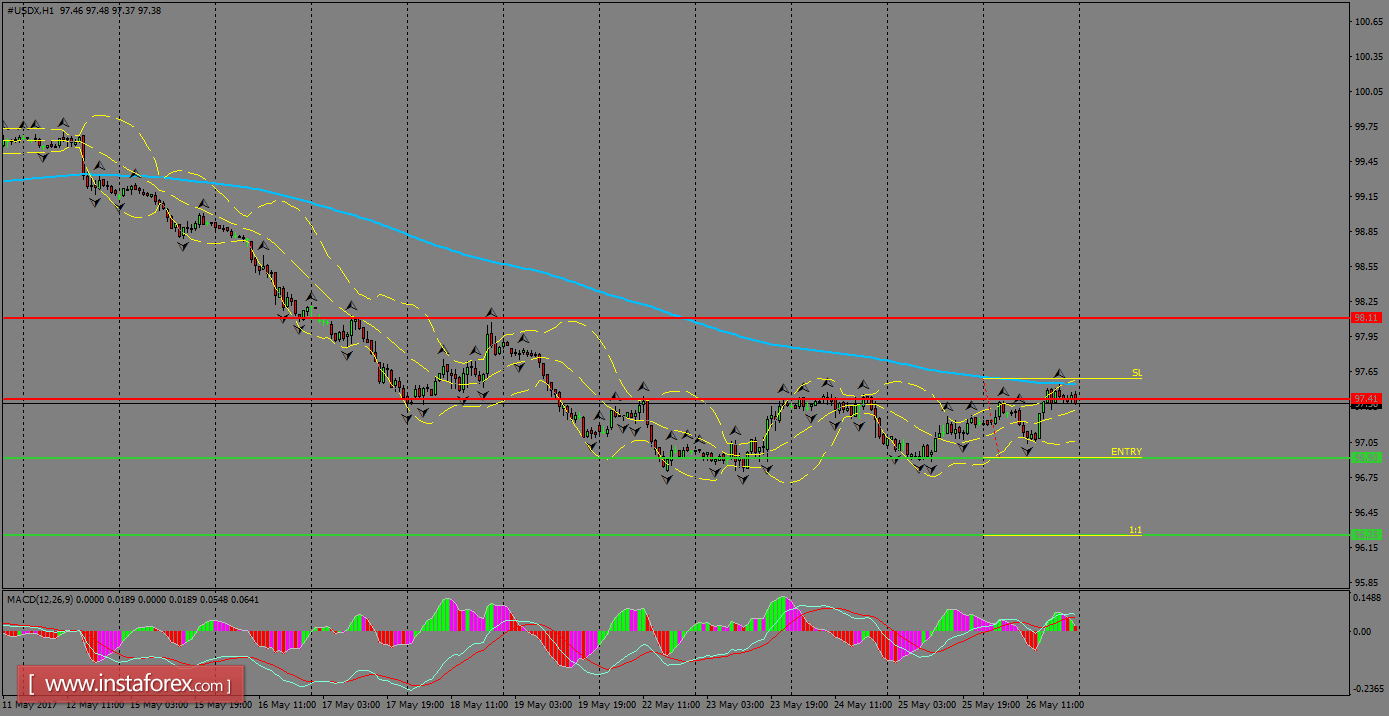
H1 chart's resistance levels: 97.41 / 98.11
H1 chart's support levels: 96.90 / 96.25
Trading recommendations for today: Based on the H1 chart, place sell (short) orders only if the USD Index breaks with a bearish candlestick; the support level is at 96.90, take profit is at 96.25 and stop loss is at 97.56.