 English
  Русский
 Bahasa Indonesia
 Bahasa Malay
 ไทย
ไทย Español
 Deutsch
 Български
 Français
 Tiếng Việt
 中文
中文 বাংলা
বাংলা हिन्दी
 Čeština
 Українська
 Română

Gold price broke out of the triangle pattern last week and has made new highs above $1,265. Bulls need to continue to show improved strength so that we should not see the breakout as a false one. Short-term target and next important resistance is at $1,277-80.
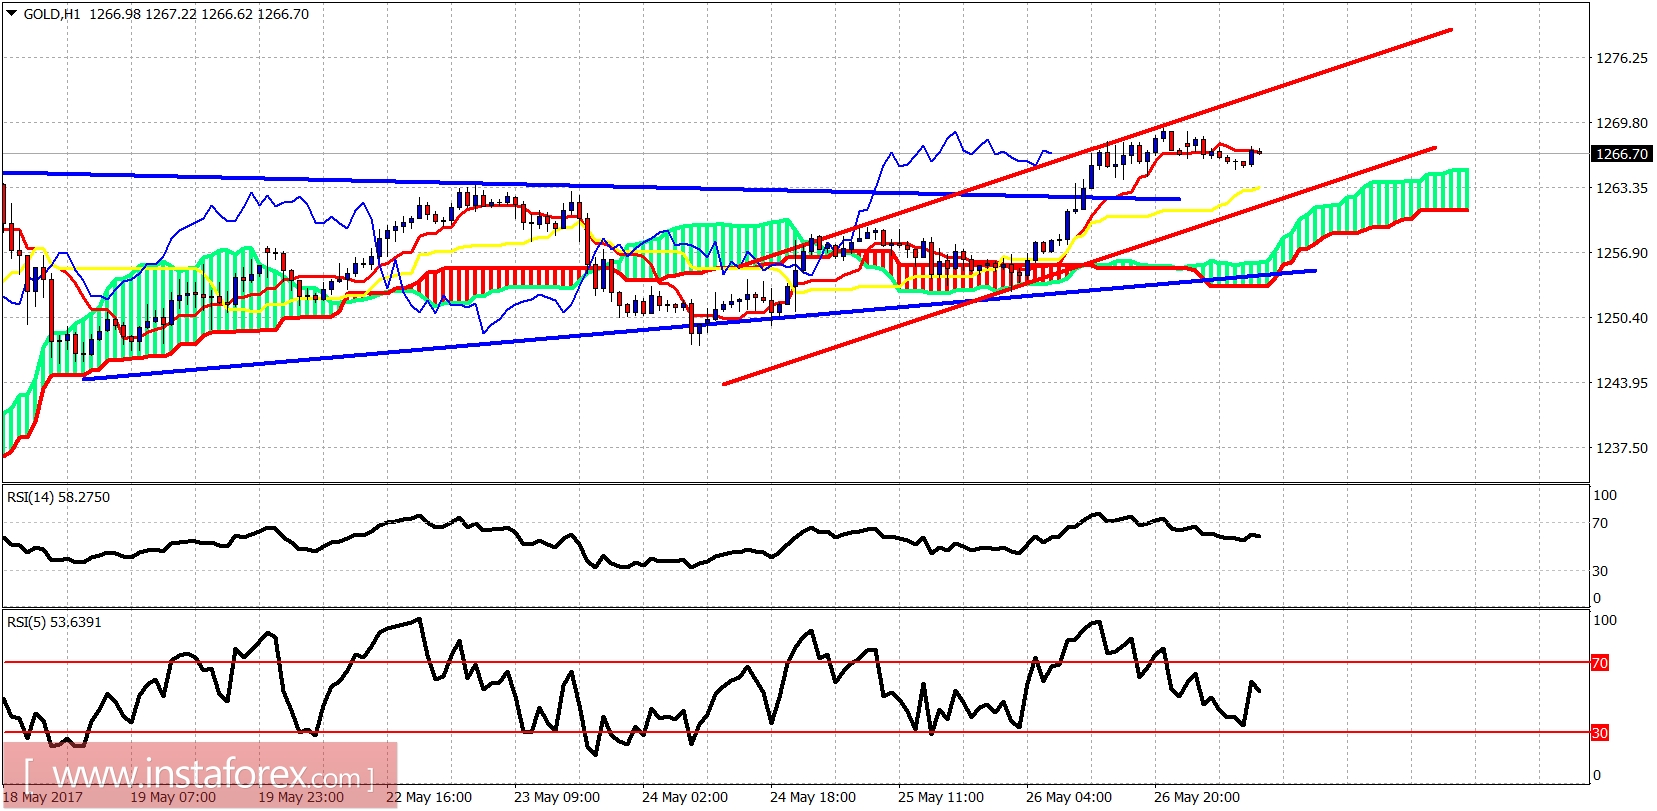
Red lines - bullish channel
Gold price is trading above the triangle pattern and inside the bullish channel. Short-term resistance at $1,277. Support is at $1,263 and next at $1,256. If support is broken, we could see Gold move towards $1,243.
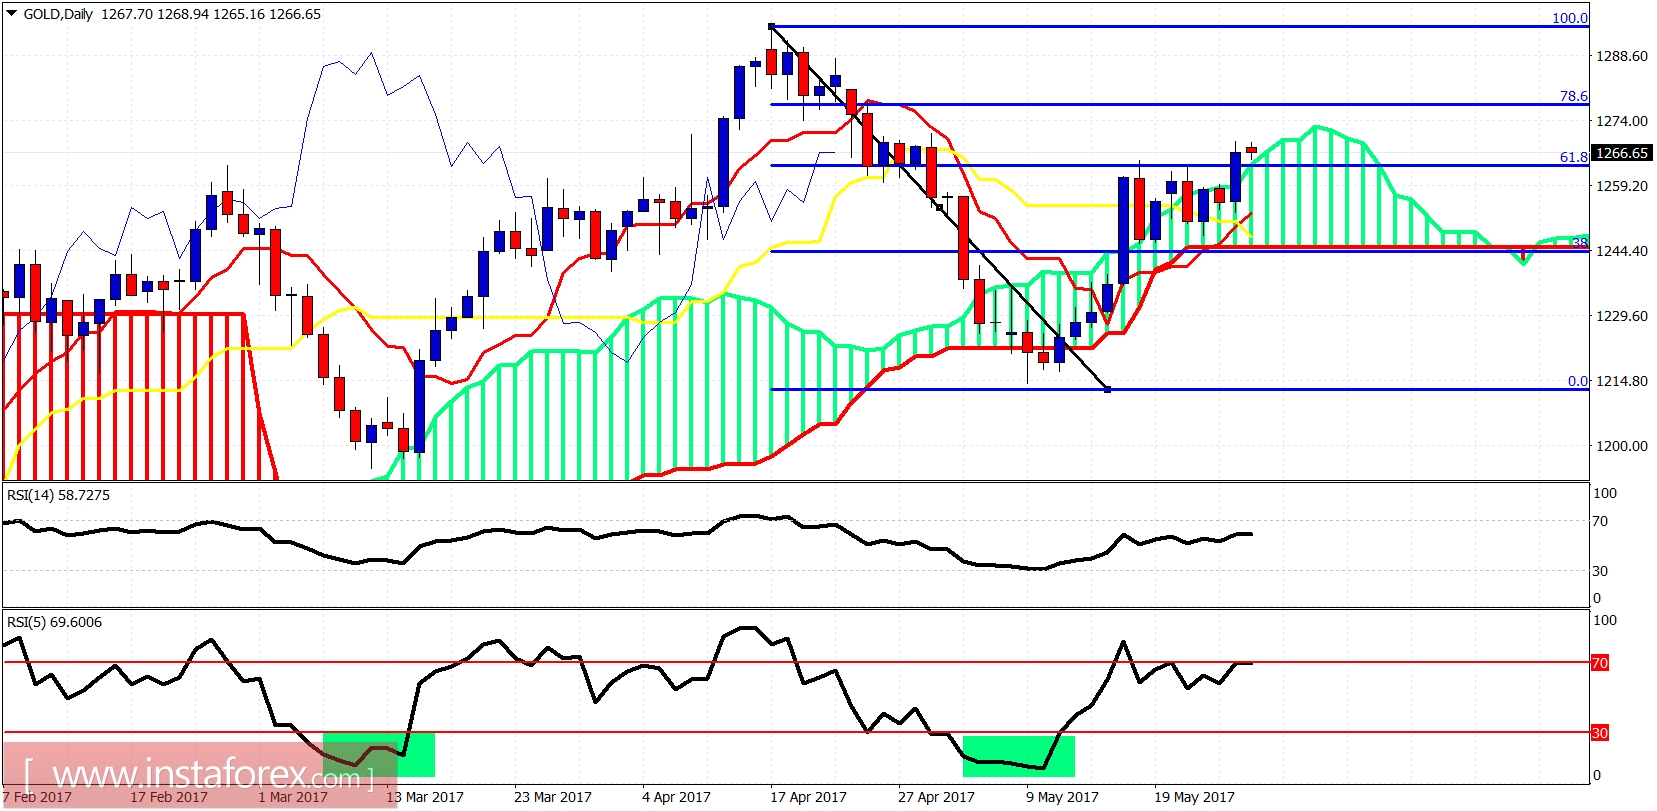
On the daily chart price has broken out of the Kumo. This is a bullish sign. However we have a small bearish divergence signal in the RSI (5). Important resistance is at $1,277 where we find the 78.6% Fibonacci retracement. Trend is bullish. A move towards $1,245 could not be ruled out and it would not change my longer-term bullish view.