 English
  Русский
 Bahasa Indonesia
 Bahasa Malay
 ไทย
ไทย Español
 Deutsch
 Български
 Français
 Tiếng Việt
 中文
中文 বাংলা
বাংলা हिन्दी
 Čeština
 Українська
 Română

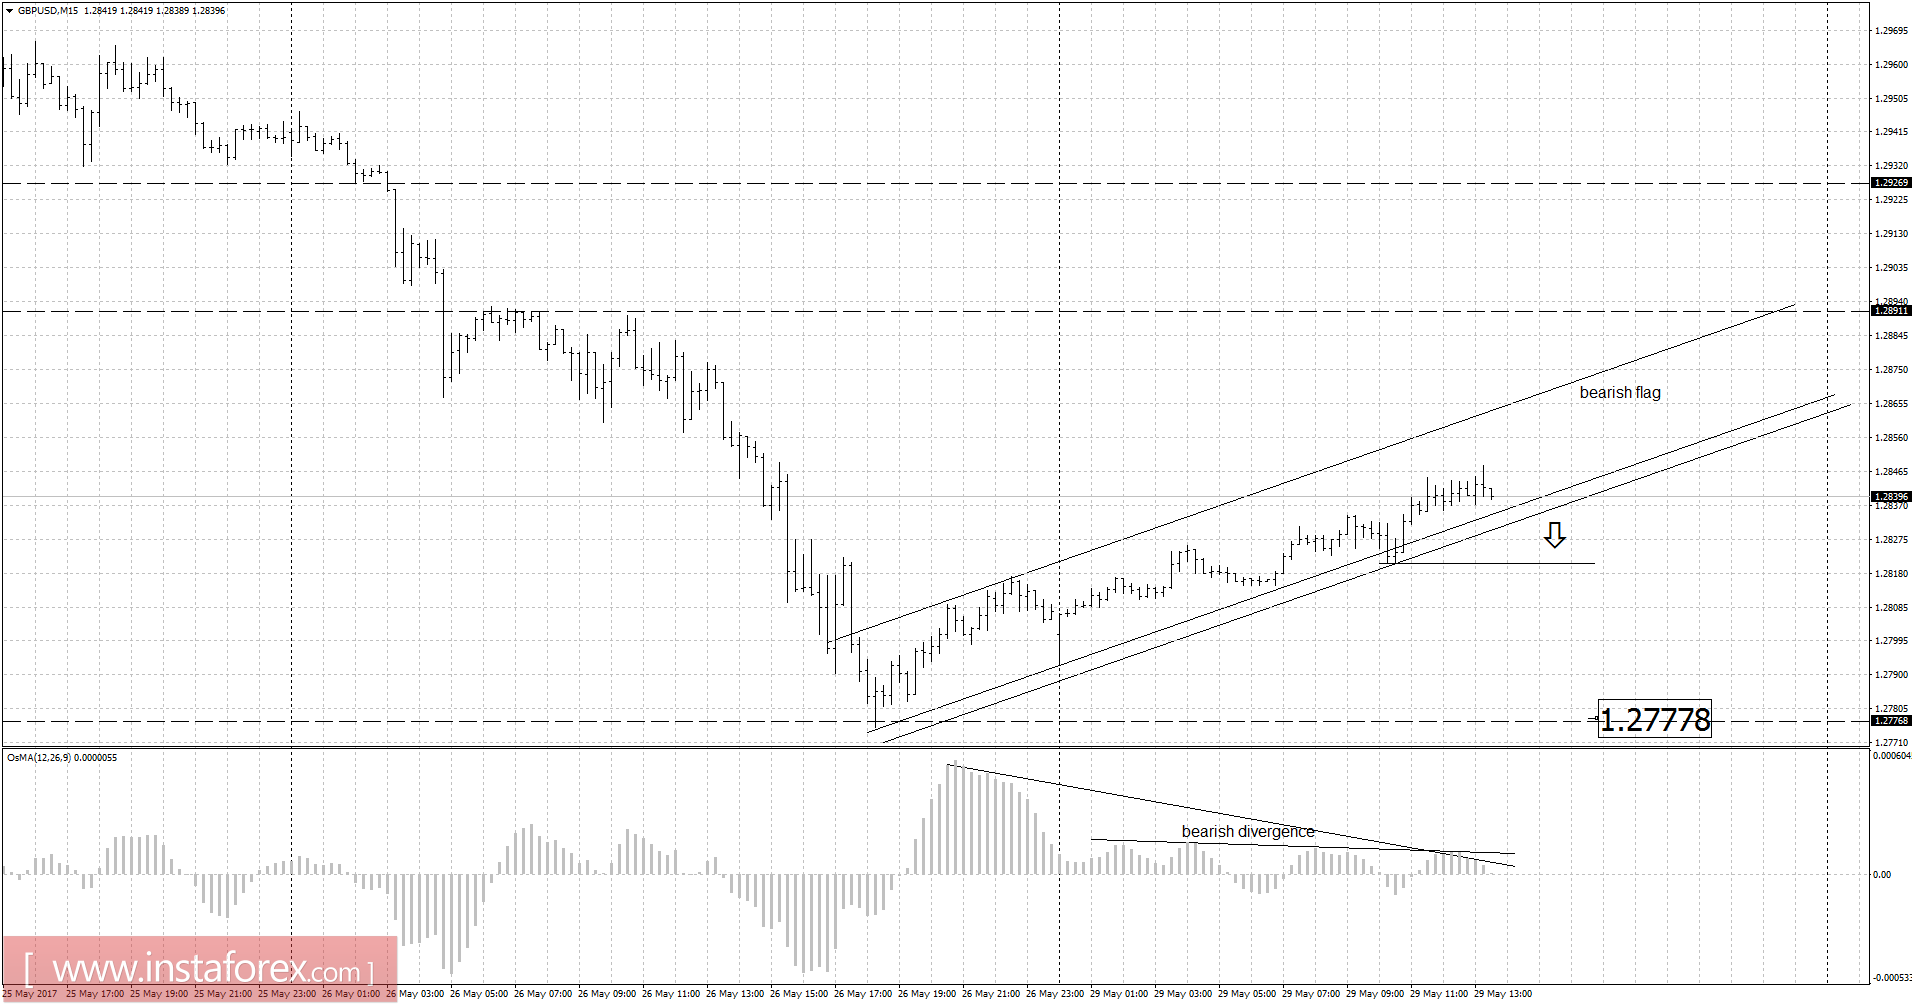
Recently, the GBP/USDr has been trading upwards. The price tested the level of 1.2848. According to the 15M time frame, I found a potential bearish flag, which is a sign of weakness. There is also a hidden bearish divergence on the moving average oscilator, which is another sign of weakness. My advice is to watch for a potential breakout of the support at 1.2820 for selling opportunities. The downward target is set at the price of 1.2777.
Resistance levels:
R1: 1.2815
R2: 1.2825
R3: 1.2830
Support levels:
S1: 1.2800
S2: 1.2795
S3: 1.2785
Trading recommendations for today: watch for potential selling opportunities.