 English
  Русский
 Bahasa Indonesia
 Bahasa Malay
 ไทย
ไทย Español
 Deutsch
 Български
 Français
 Tiếng Việt
 中文
中文 বাংলা
বাংলা हिन्दी
 Čeština
 Українська
 Română

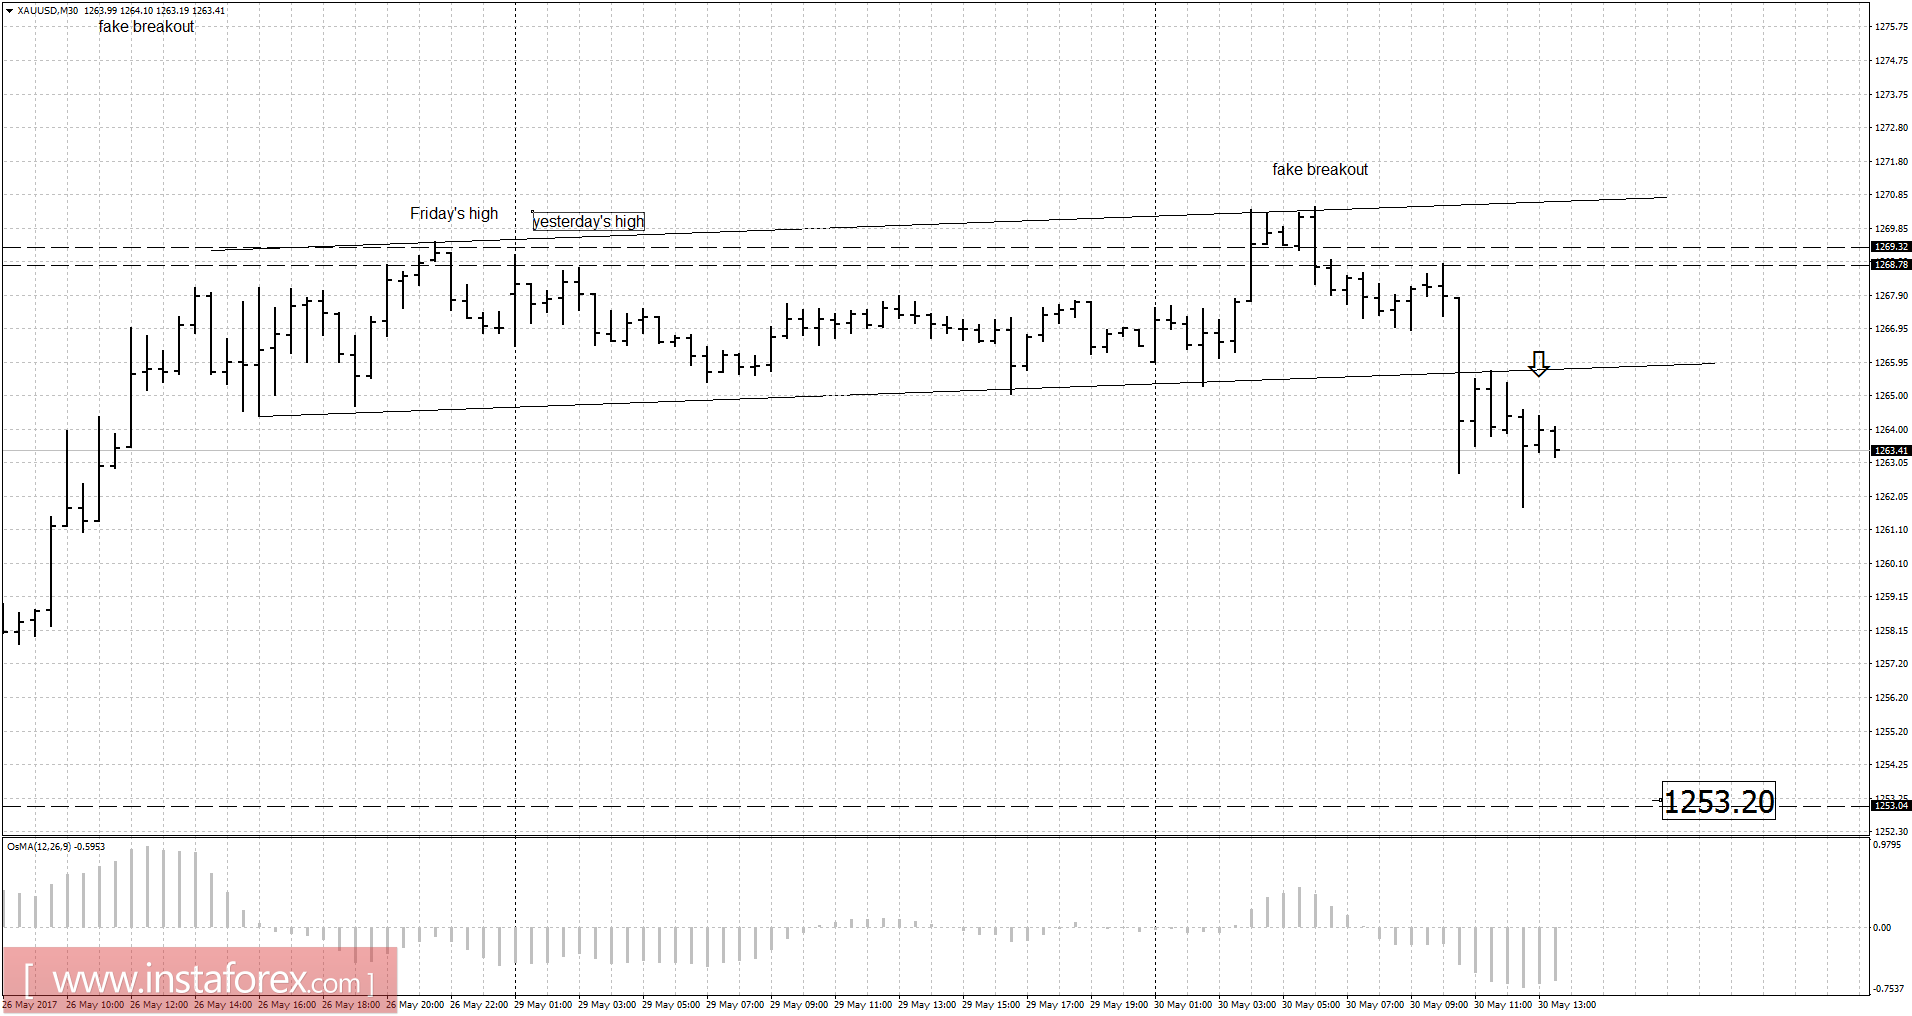
Recently, Gold has been trading sideways at the price of $1,264.00. Anyway, according to the 30M time frame, I found a fake breakout of a 2-day high, which is a sign that buying looks riksy. There is also a breakout of the upward channel, which is another sign of weakness. My advice is to watch for potential selling opportunities. The downward target is set at the price of $1,253.20.
Resistance levels:
R1: $1,267.20
R2: $1,269.00
R3: $1,271.60
Support levels:
S1: $1,261.90
S2: $1,260.00
S3: $1,257.50
Trading recommendations for today: watch for potential selling opportunities.