 English
  Русский
 Bahasa Indonesia
 Bahasa Malay
 ไทย
ไทย Español
 Deutsch
 Български
 Français
 Tiếng Việt
 中文
中文 বাংলা
বাংলা हिन्दी
 Čeština
 Українська
 Română

USDX struggled to consolidate above the 200 SMA at H1 chart, as the bears were the main driver of the index during Tuesday's session. Currently, it's targeting the support zone of 96.90 with bearish projections towards the 96.25 level. To the upside, the next resistances are still placed around 97.41 and 98.11. MACD indicator still supports the bearish's scenario.
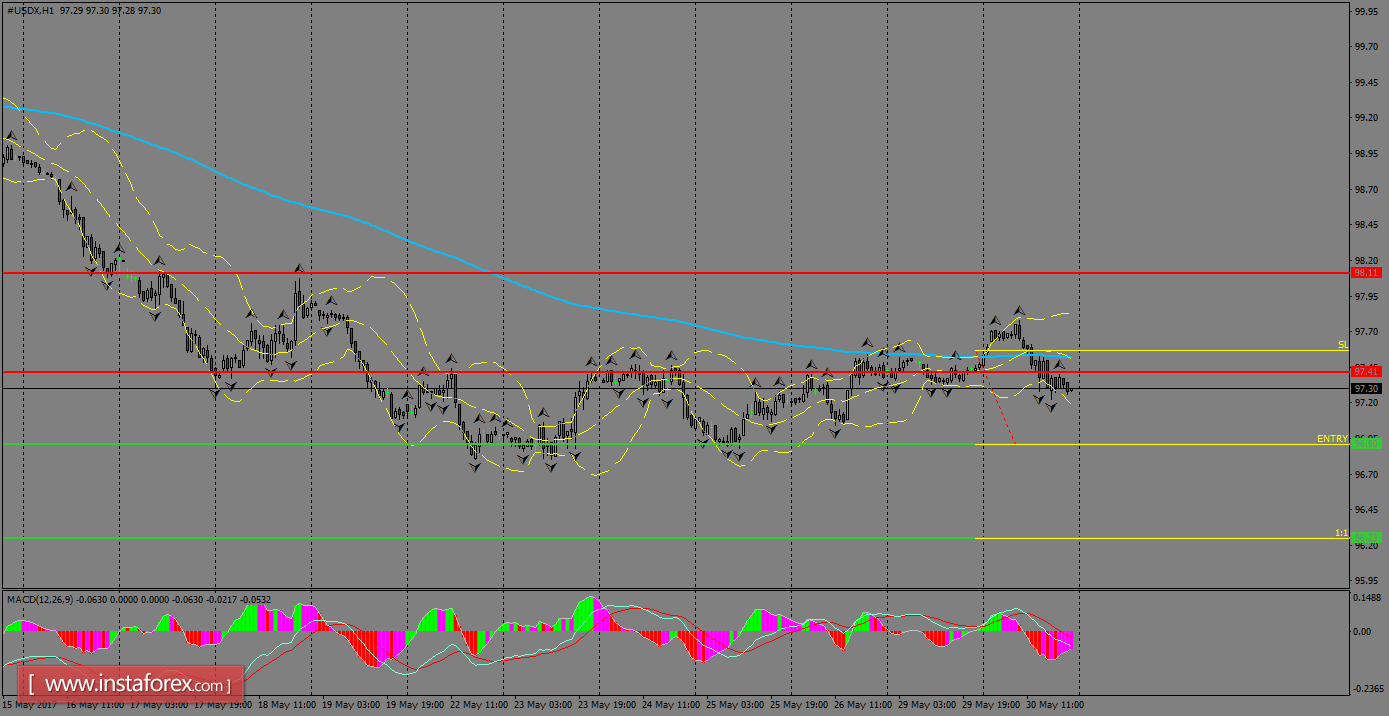
H1 chart's resistance levels: 97.41 / 98.11
H1 chart's support levels: 96.90 / 96.25
Trading recommendations for today: Based on the H1 chart, place sell (short) orders only if the USD Index breaks with a bearish candlestick; the support level is at 96.90, take profit is at 96.25 and stop loss is at 97.56.