 English
  Русский
 Bahasa Indonesia
 Bahasa Malay
 ไทย
ไทย Español
 Deutsch
 Български
 Français
 Tiếng Việt
 中文
中文 বাংলা
বাংলা हिन्दी
 Čeština
 Українська
 Română

The Dollar index strength was short lived as price fell back towards short-term support at 97.25 area. Price remains inside a sideways channel and trading range. We need a clear break above 97.75 or below 97 to see a clear trending move.
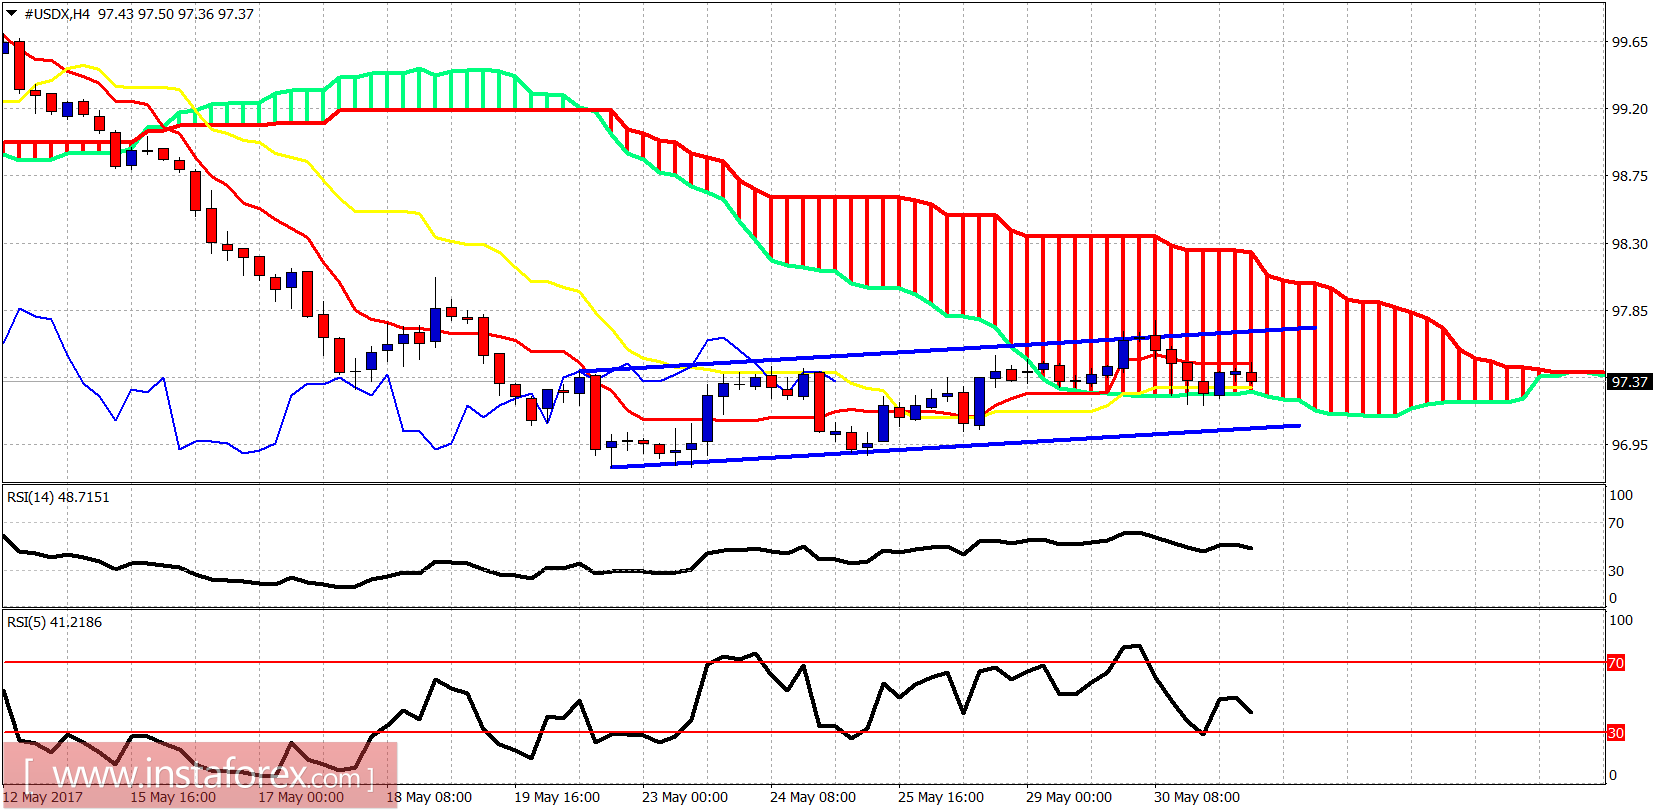
The Dollar index is trading inside the 4-hour Kumo. Trend is neutral as we also mentioned yesterday. Unless the trading range boundaries are broken, we will remain in the range until Friday and the announcement of the NFP data.
Green line - support (broken)
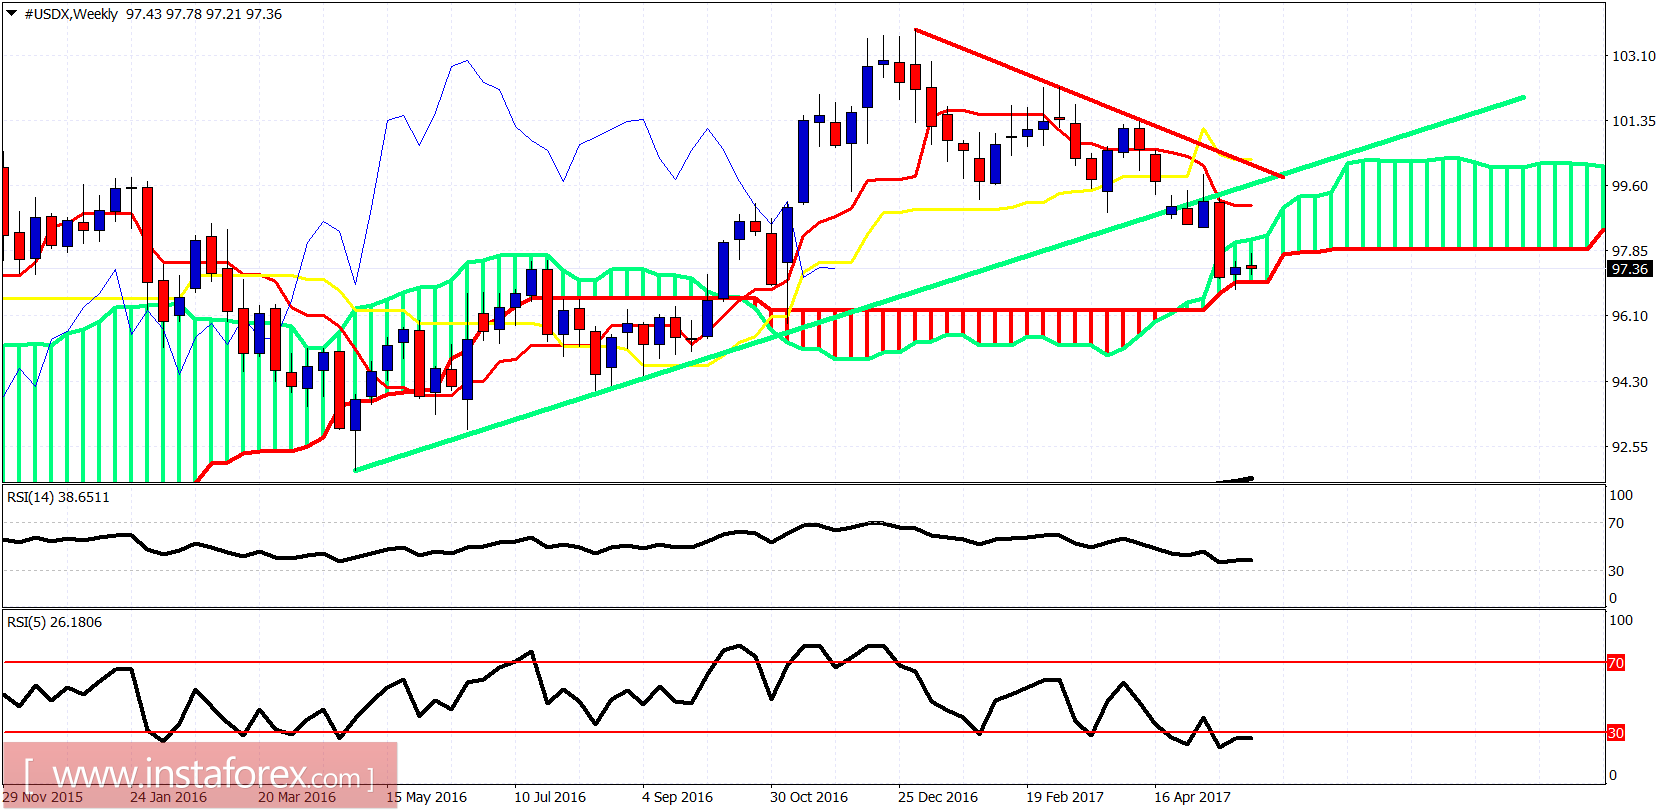
The weekly candles are at important Kumo (cloud) support. I expect a bounce from the 97 area and the Friday NFP data could be the trigger behind the expected Dollar bounce. I would not be bearish at current levels.