English
  Русский
 Bahasa Indonesia
 Bahasa Malay
 ไทย
ไทย Español
 Deutsch
 Български
 Français
 Tiếng Việt
 中文
中文 বাংলা
বাংলা हिन्दी
 Čeština
 Українська
 Română

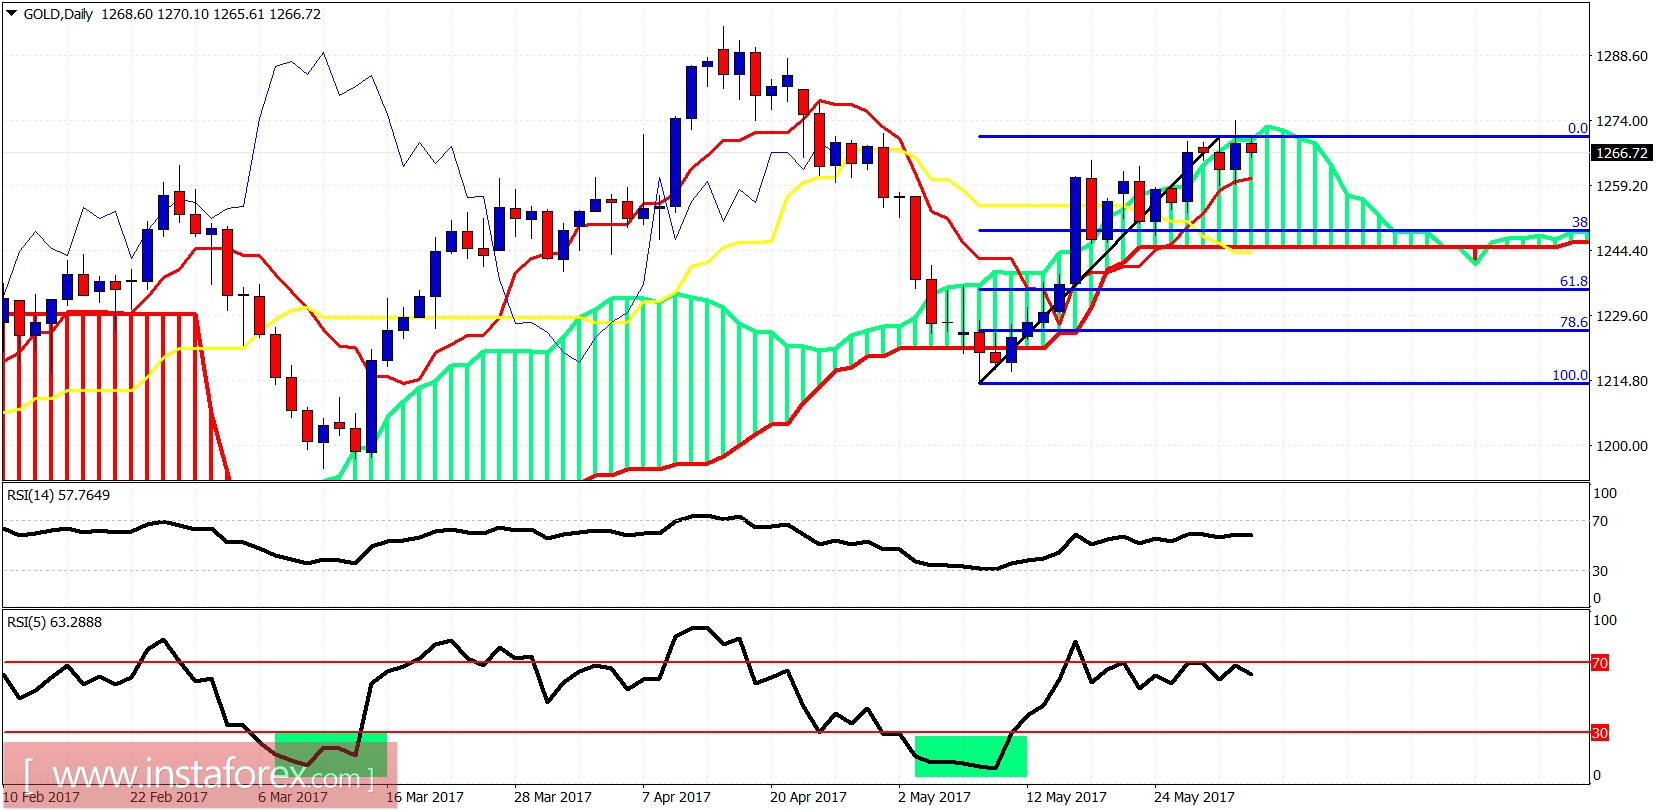
Gold price has reached the upper trading range boundary resistance and is pulling back down. Short-term traders could try and profit from short positions with tight stops at $1,275 as a pullback towards the lower boundary level is justified.
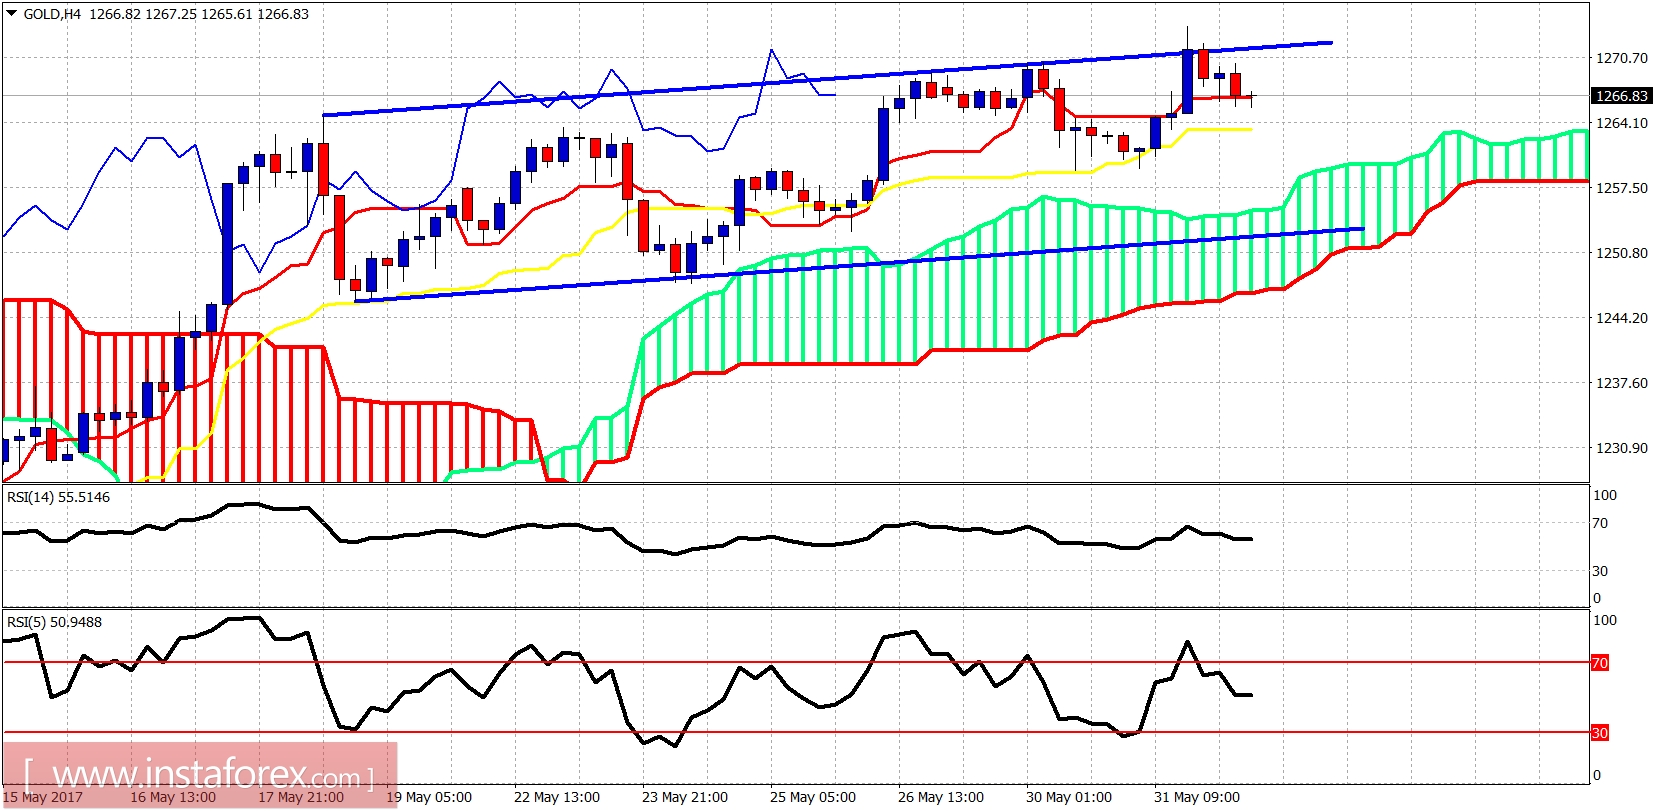
Gold price got rejected at the upper blue trading range boundary. Price remains above both the tenkan- and kijun-sen indicators. Trend remains bullish. As said in previous posts, we could see a slow grind higher but overall I expect price to pull back towards $1,255.