 English
  Русский
 Bahasa Indonesia
 Bahasa Malay
 ไทย
ไทย Español
 Deutsch
 Български
 Français
 Tiếng Việt
 中文
中文 বাংলা
বাংলা हिन्दी
 Čeština
 Українська
 Română

USDX managed to hold its structure above the support level of 96.90, as the bulls gained momentum across the board, but the gains are still limited. The 200 SMA at the H1 chart is still offering dynamic resistance in the short-term. The index might plummet below 96.90 to reach the support level of 96.25. MACD indicator remains at the positive territory.
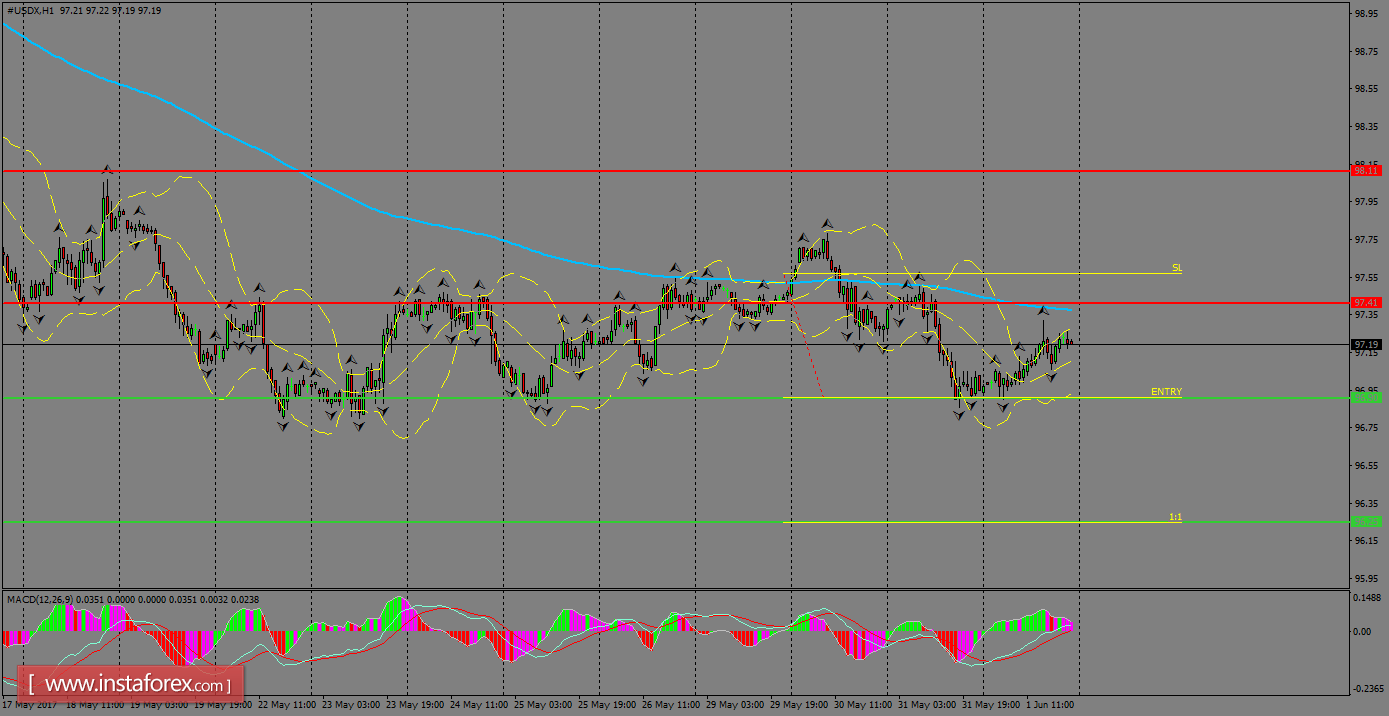
H1 chart's resistance levels: 97.41 / 98.11
H1 chart's support levels: 96.90 / 96.25
Trading recommendations for today: Based on the H1 chart, place sell (short) orders only if the USD Index breaks with a bearish candlestick; the support level is at 96.90, take profit is at 96.25 and stop loss is at 97.56.