 English
  Русский
 Bahasa Indonesia
 Bahasa Malay
 ไทย
ไทย Español
 Deutsch
 Български
 Français
 Tiếng Việt
 中文
中文 বাংলা
বাংলা हिन्दी
 Čeština
 Українська
 Română

The Dollar index remains above critical support at 97. Price held support yesterday and is bouncing towards short-term resistance. Trend remains bearish and there is still no confirmation of a trend change. We could see a trend reversal today after the NFP.
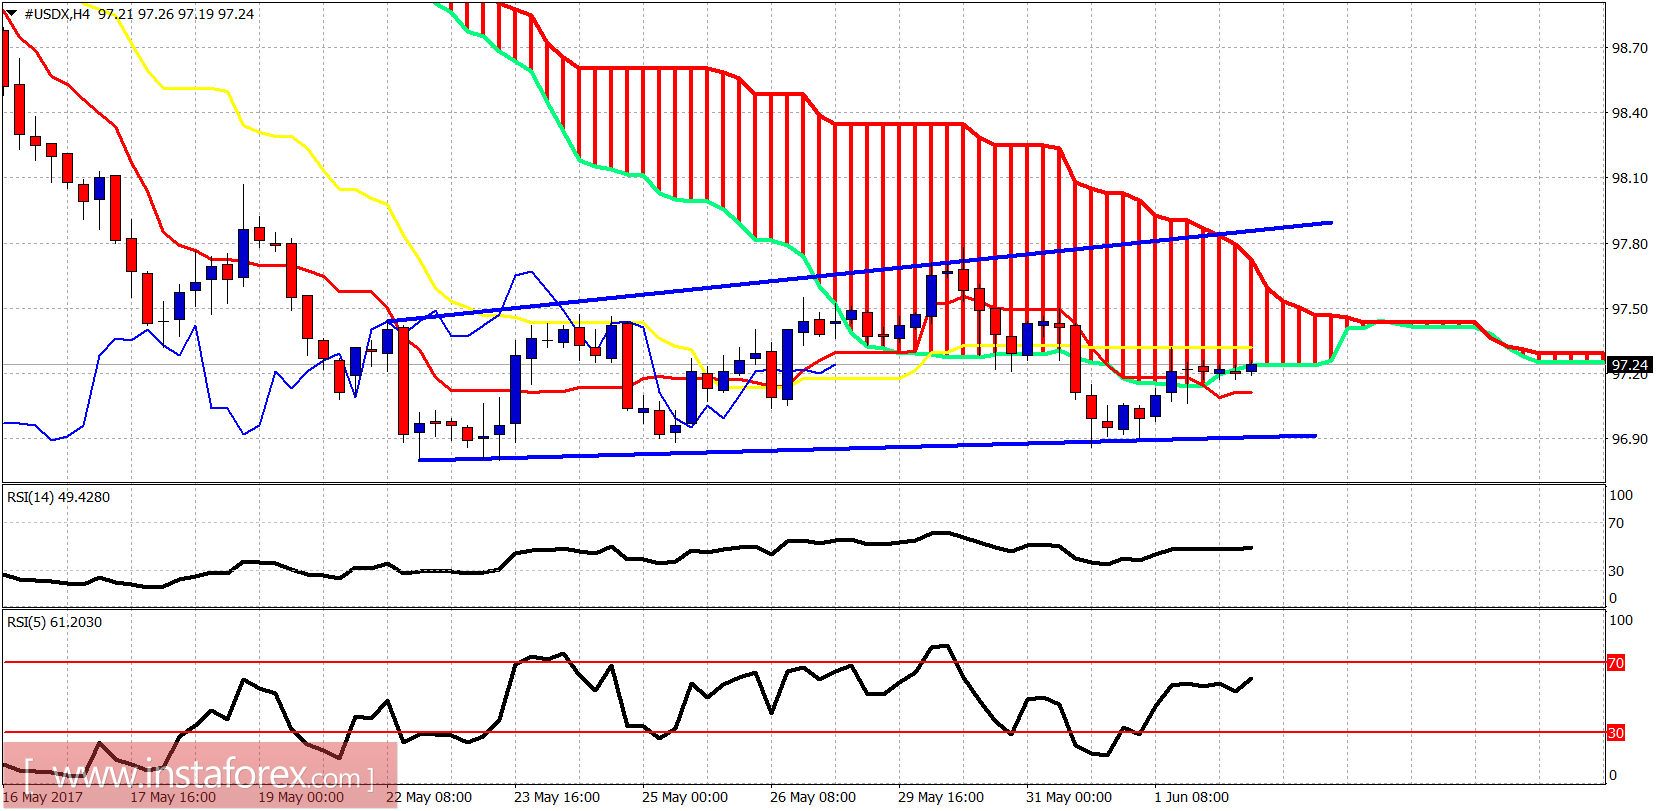
The Dollar index is trying to get back inside the neutral trend zone of the Ichimoku cloud in the 4-hour chart. Resistance is here at 97.20-97.30. Next important resistance is at 97.50. A breakout and above the cloud could be a trend reversal signal.
Green line - broken trend line support
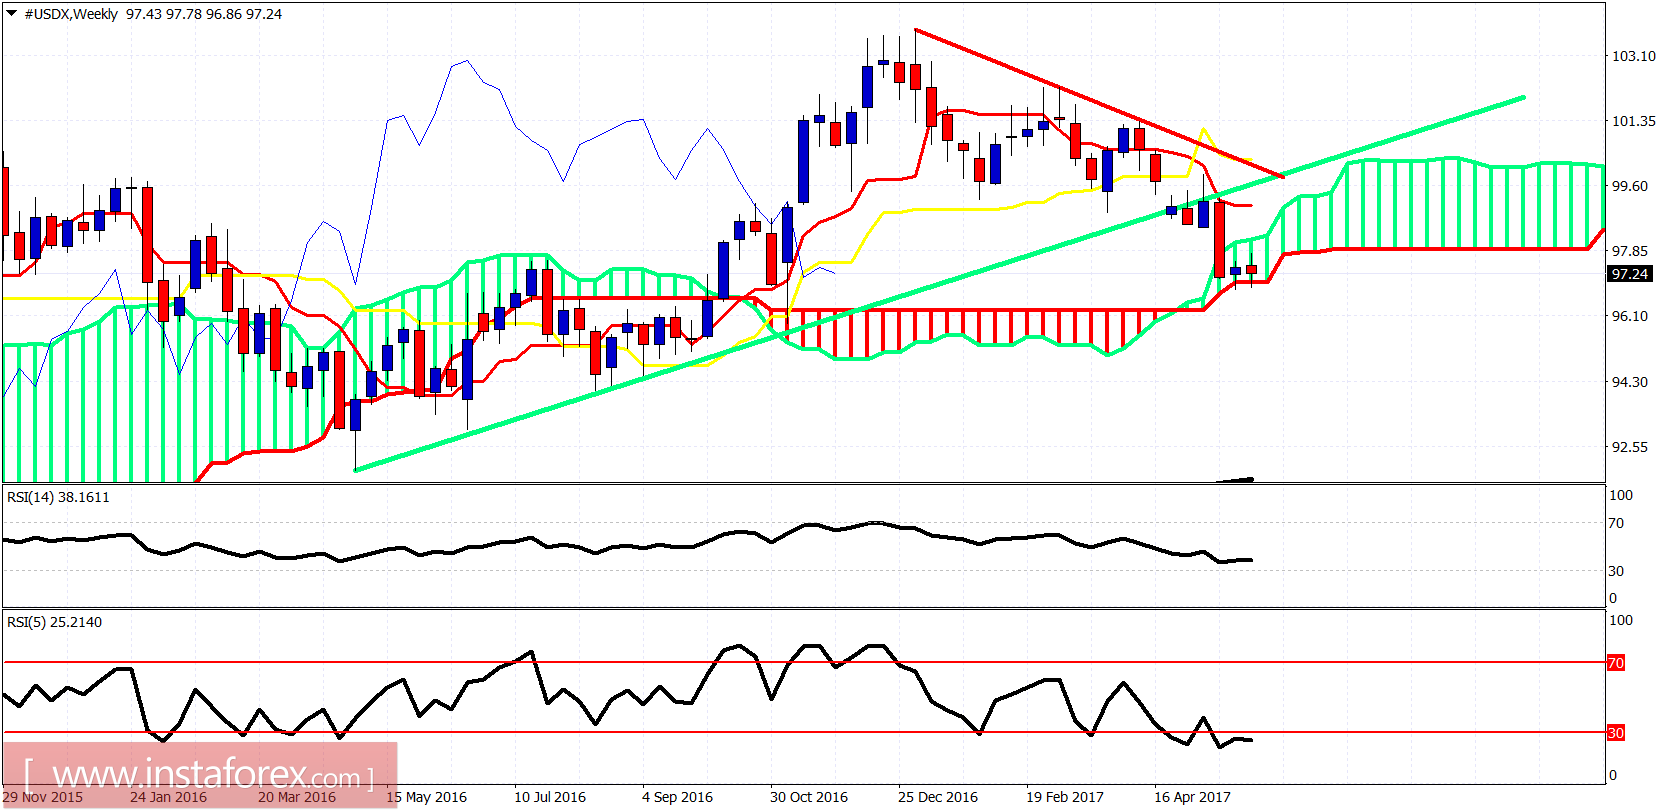
The Dollar index is at important weekly support. A bounce of this area is expected. The target is the broken green trend line or the downward sloping red trend line. I would not be bearish on the Dollar at current levels. I would prefer to short the Dollar after a strong bounce.