 English
  Русский
 Bahasa Indonesia
 Bahasa Malay
 ไทย
ไทย Español
 Deutsch
 Български
 Français
 Tiếng Việt
 中文
中文 বাংলা
বাংলা हिन्दी
 Čeština
 Українська
 Română

The index had a strong decline on Friday after the disappointing jobs data in the United States and it's now piercing the 96.90 level. The target is now placed to the downside around 96.25 and having in mind that USDX was trapped in a bearish consolidation, such scenario is feasible for the short-term. MACD indicator is turning negative and favoring the downside.
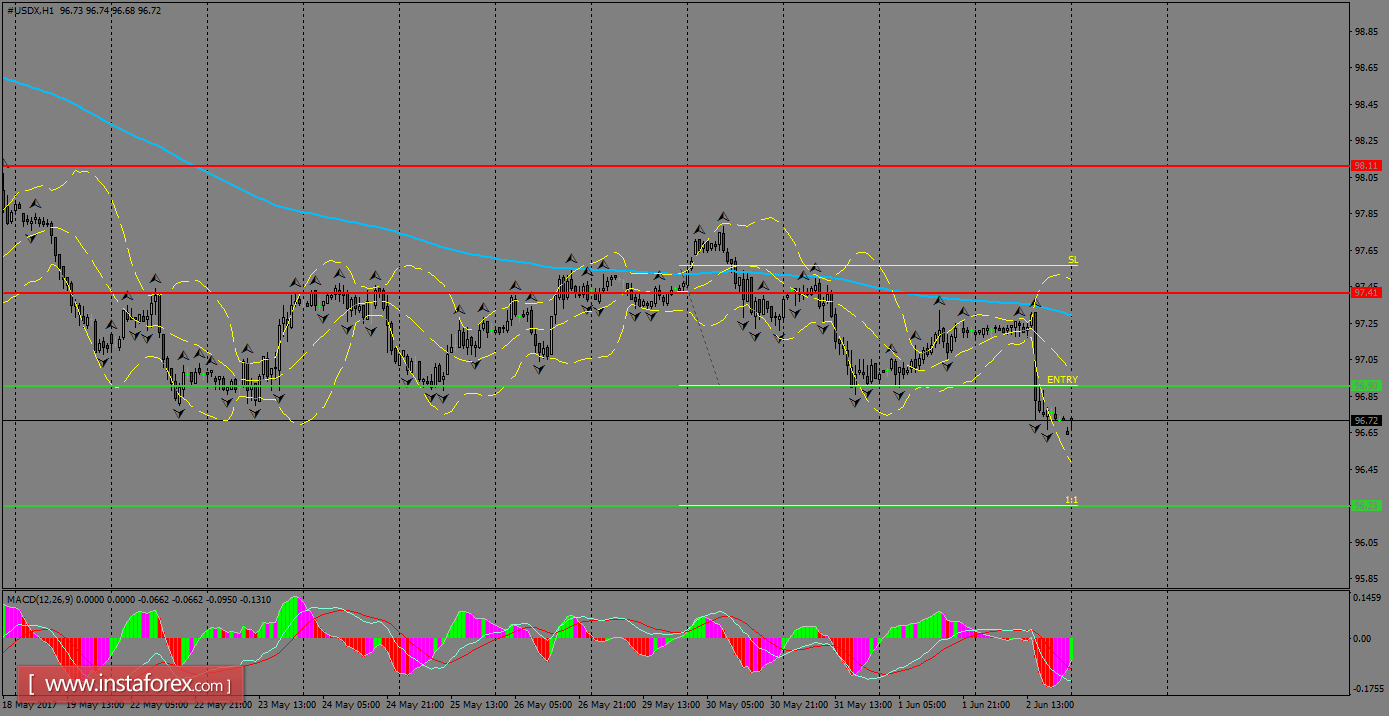
H1 chart's resistance levels: 97.41 / 98.11
H1 chart's support levels: 96.90 / 96.25
Trading recommendations for today: Based on the H1 chart, place sell (short) orders only if the USD Index breaks with a bearish candlestick; the support level is at 96.90, take profit is at 96.25 and stop loss is at 97.56.