 English
  Русский
 Bahasa Indonesia
 Bahasa Malay
 ไทย
ไทย Español
 Deutsch
 Български
 Français
 Tiếng Việt
 中文
中文 বাংলা
বাংলা हिन्दी
 Čeština
 Українська
 Română

The Dollar index remains in a bearish oversold trend diverging. As I have said in previous posts, I prefer to be at least neutral at current or lower levels if not bullish as I expect the Dollar index to make a strong bounce soon.
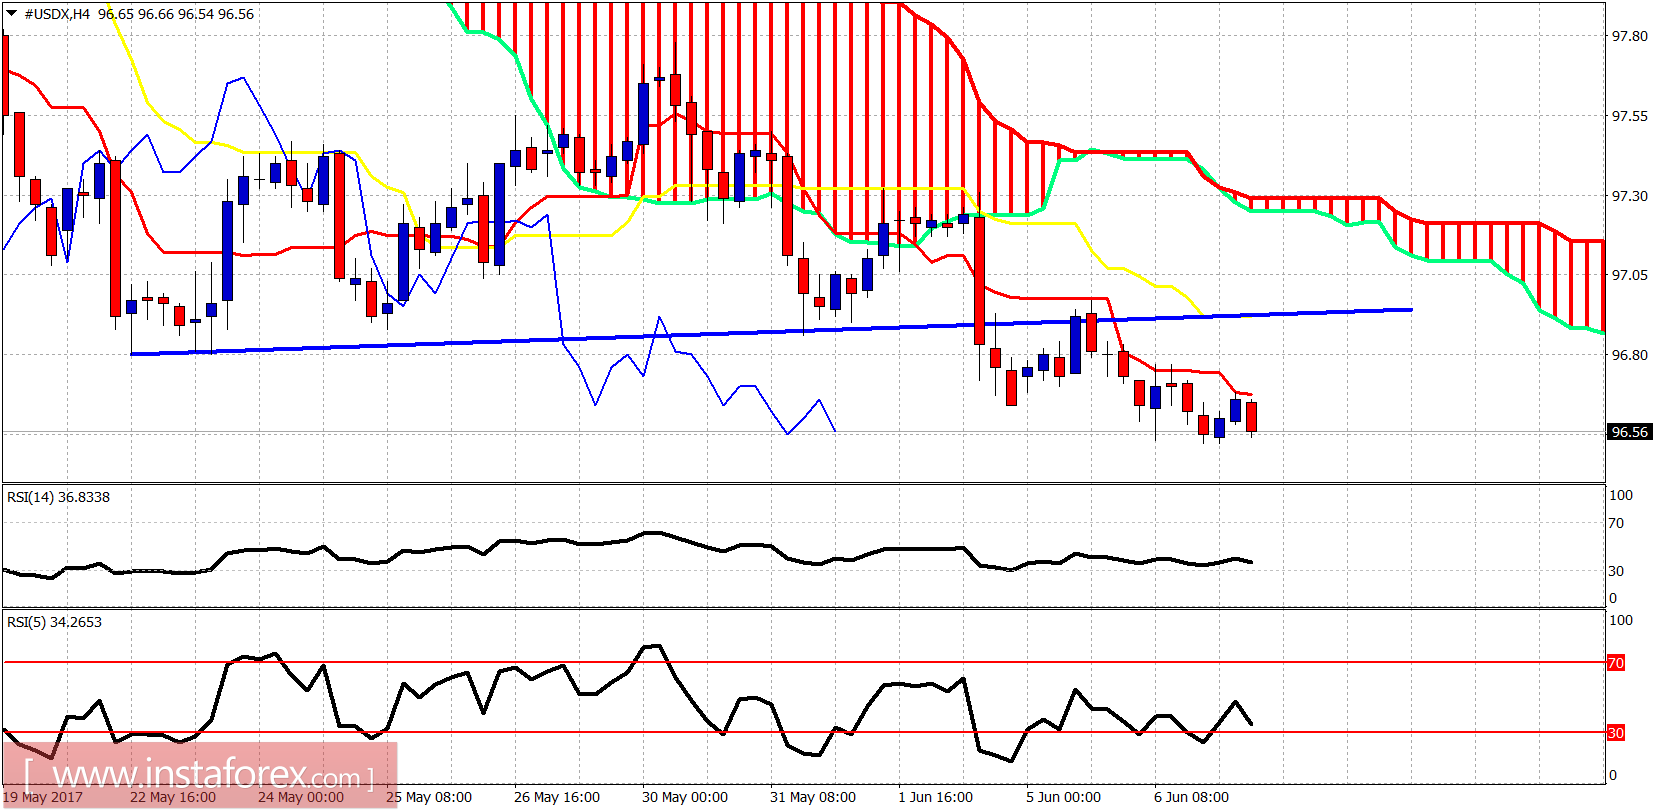
Price is making lower lows and lower highs in the 4-hour chart and trend is clearly bearish. Short-term resistance is at 96.70. A 4-hour close above it will open the way for a backtest of the broken support blue trend line at 96.95.
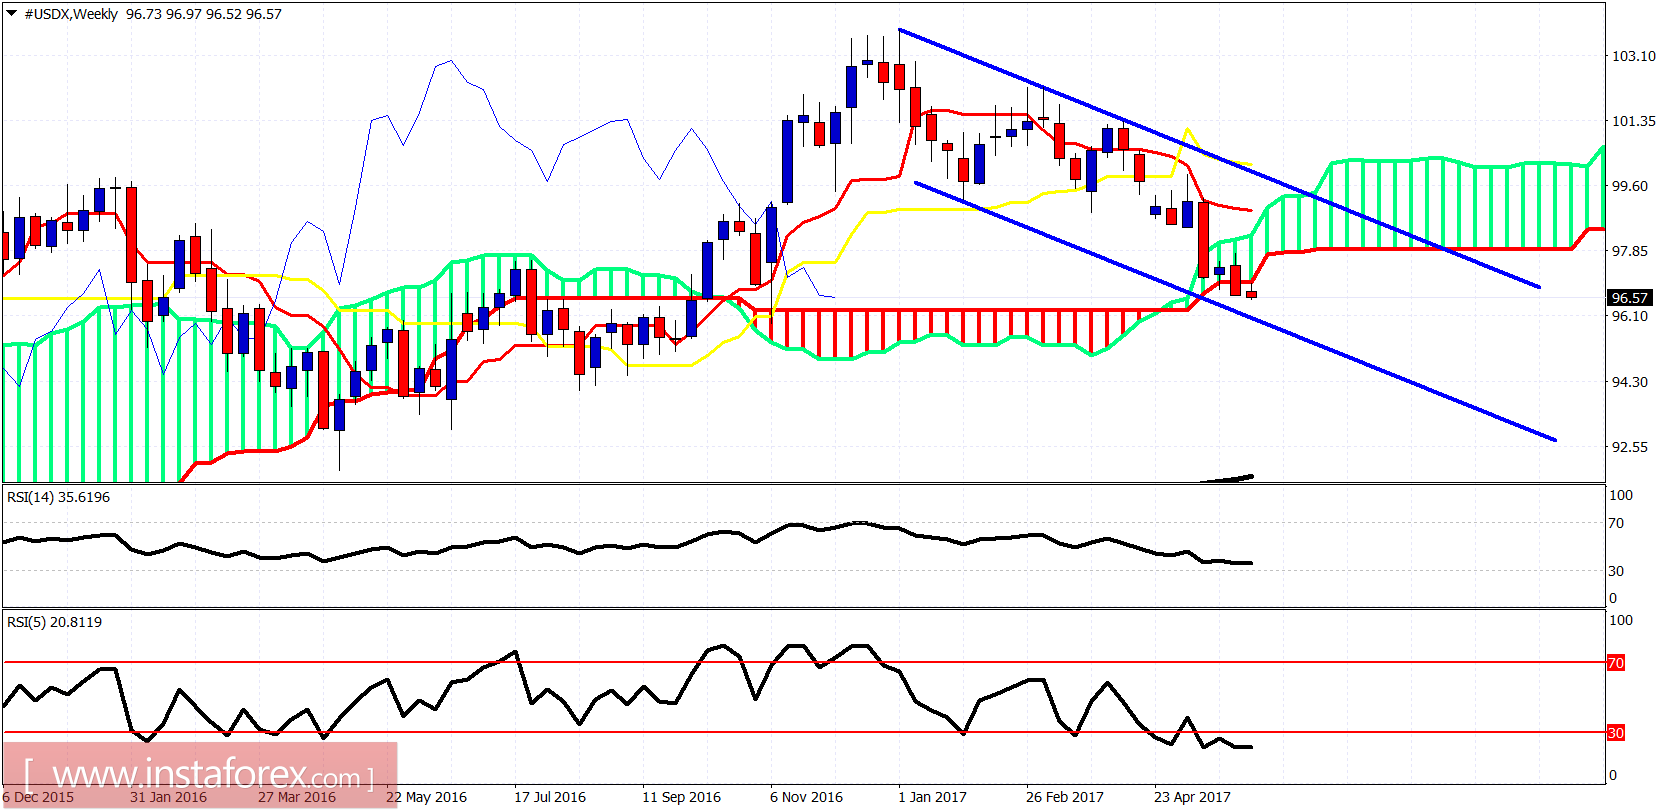
The Dollar index weekly chart has broken below the weekly cloud. I expect price to reach the lower channel boundary around 96 and bounce towards 98 for a backtest of the broken weekly cloud. I prefer to look for short positions only after a bounce in the Dollar index.