 English
  Русский
 Bahasa Indonesia
 Bahasa Malay
 ไทย
ไทย Español
 Deutsch
 Български
 Français
 Tiếng Việt
 中文
中文 বাংলা
বাংলা हिन्दी
 Čeština
 Українська
 Română

Gold price is showing reversal signs. It is still too early to tell if the pullback towards $1,250 we expect has started or something of a smaller degree. Important level to watch is at $1,277.
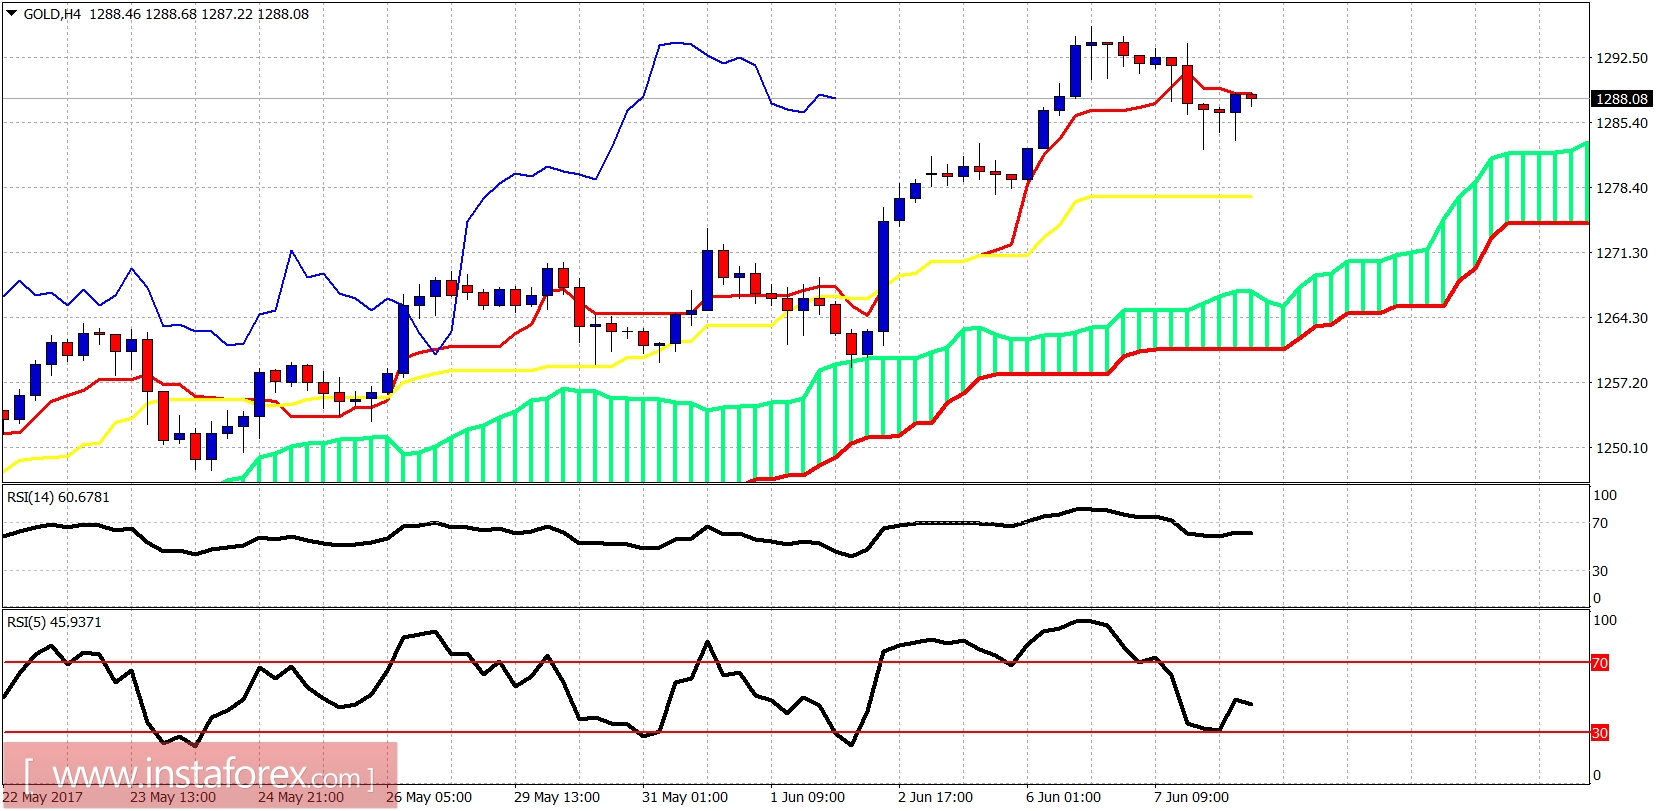
If this level is broken, a medium-term top will be in and a correction towards $1,250 will start.
Blue line - support
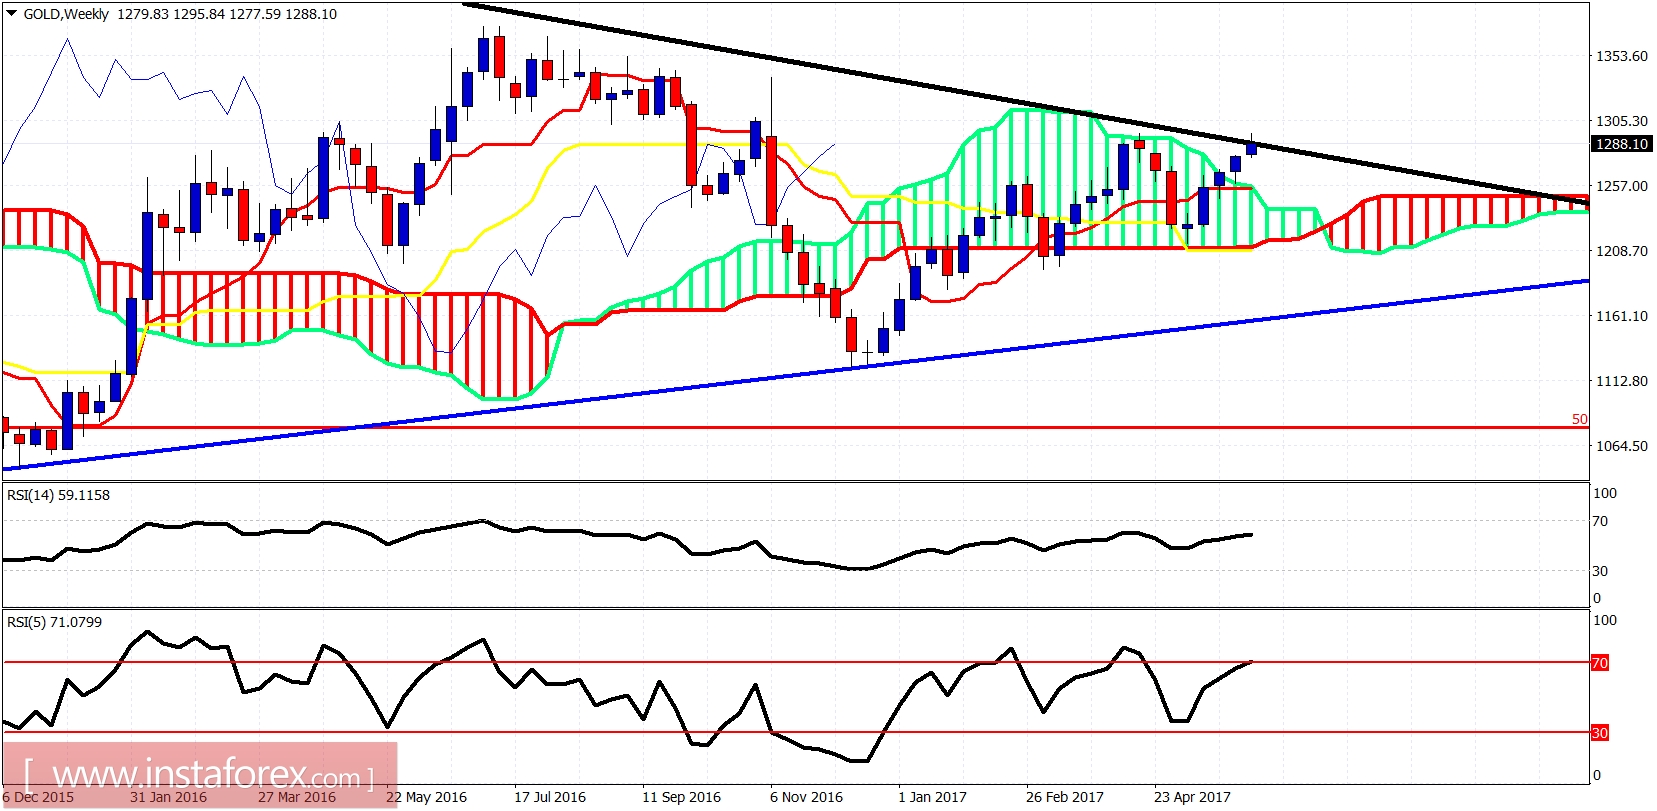
The weekly candle has broken out of the Kumo (cloud) and this is a very bullish sign. Price is testing important long-term resistance. A pullback towards the weekly cloud is expected before the next leg up that will eventually push price towards $1,400 and higher. I remain longer-term bullish about Gold and I believe bulls will get another opportunity to go long at lower than the current price levels.