 English
  Русский
 Bahasa Indonesia
 Bahasa Malay
 ไทย
ไทย Español
 Deutsch
 Български
 Français
 Tiếng Việt
 中文
中文 বাংলা
বাংলা हिन्दी
 Čeština
 Українська
 Română

The pair increased its pressure to the downside and it's looking to test the next critical area around 1.2547, as it managed to break last Friday's lows. However, because of the sharp decline, GBP/USD can start to do some rebounds in order to reach the resistance level of 1.2753 in an attempt to erase some of the losses.
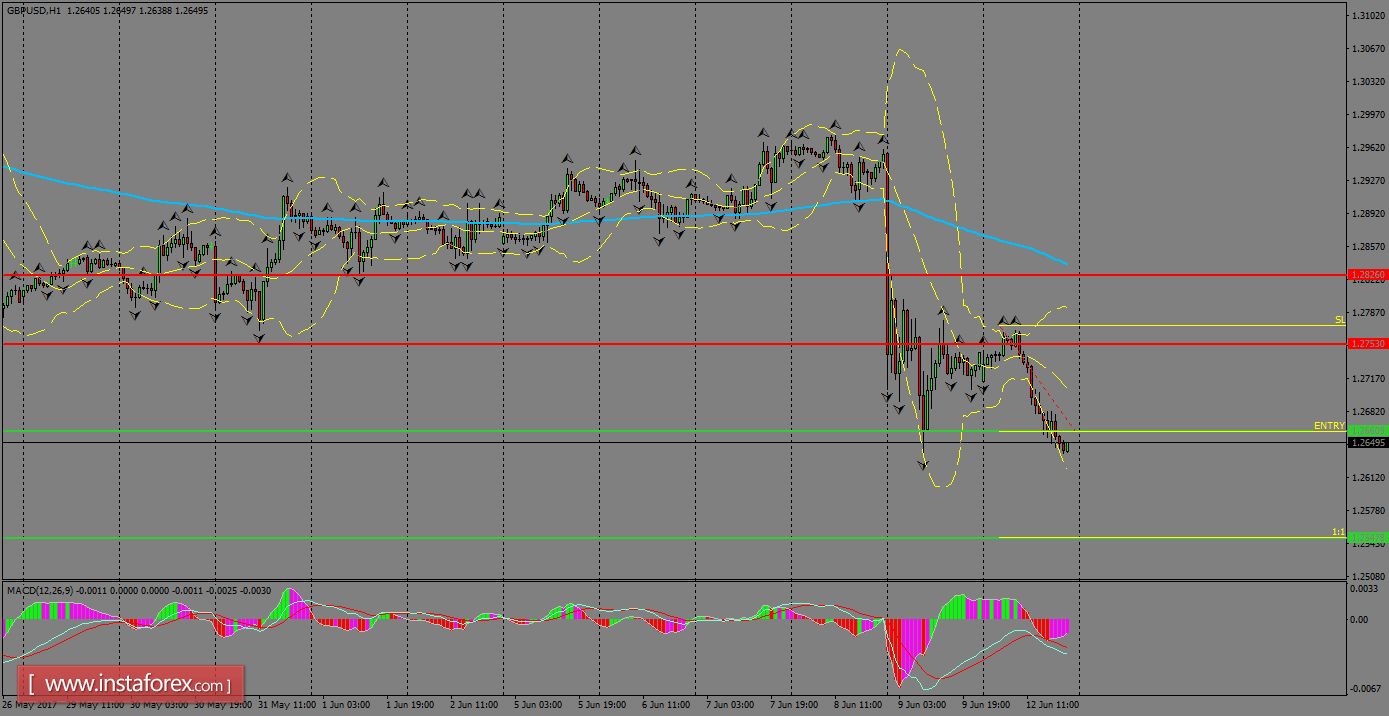
H1 chart's resistance levels: 1.2753 / 1.2826
H1 chart's support levels: 1.2660 / 1.2547
Trading recommendations for today: Based on the H1 chart, sell (short) orders only if the GBP/USD pair breaks a bearish candlestick; the support level is at 1.2660, take profit is at 1.2547 and stop loss is at 1.2773.