 English
  Русский
 Bahasa Indonesia
 Bahasa Malay
 ไทย
ไทย Español
 Deutsch
 Български
 Français
 Tiếng Việt
 中文
中文 বাংলা
বাংলা हिन्दी
 Čeština
 Українська
 Română

The Dollar index continues to point to a bounce towards 98.5-99 and I continue to favor the bullish side. I believe that only after a bounce towards 99 we should look to short the index again.
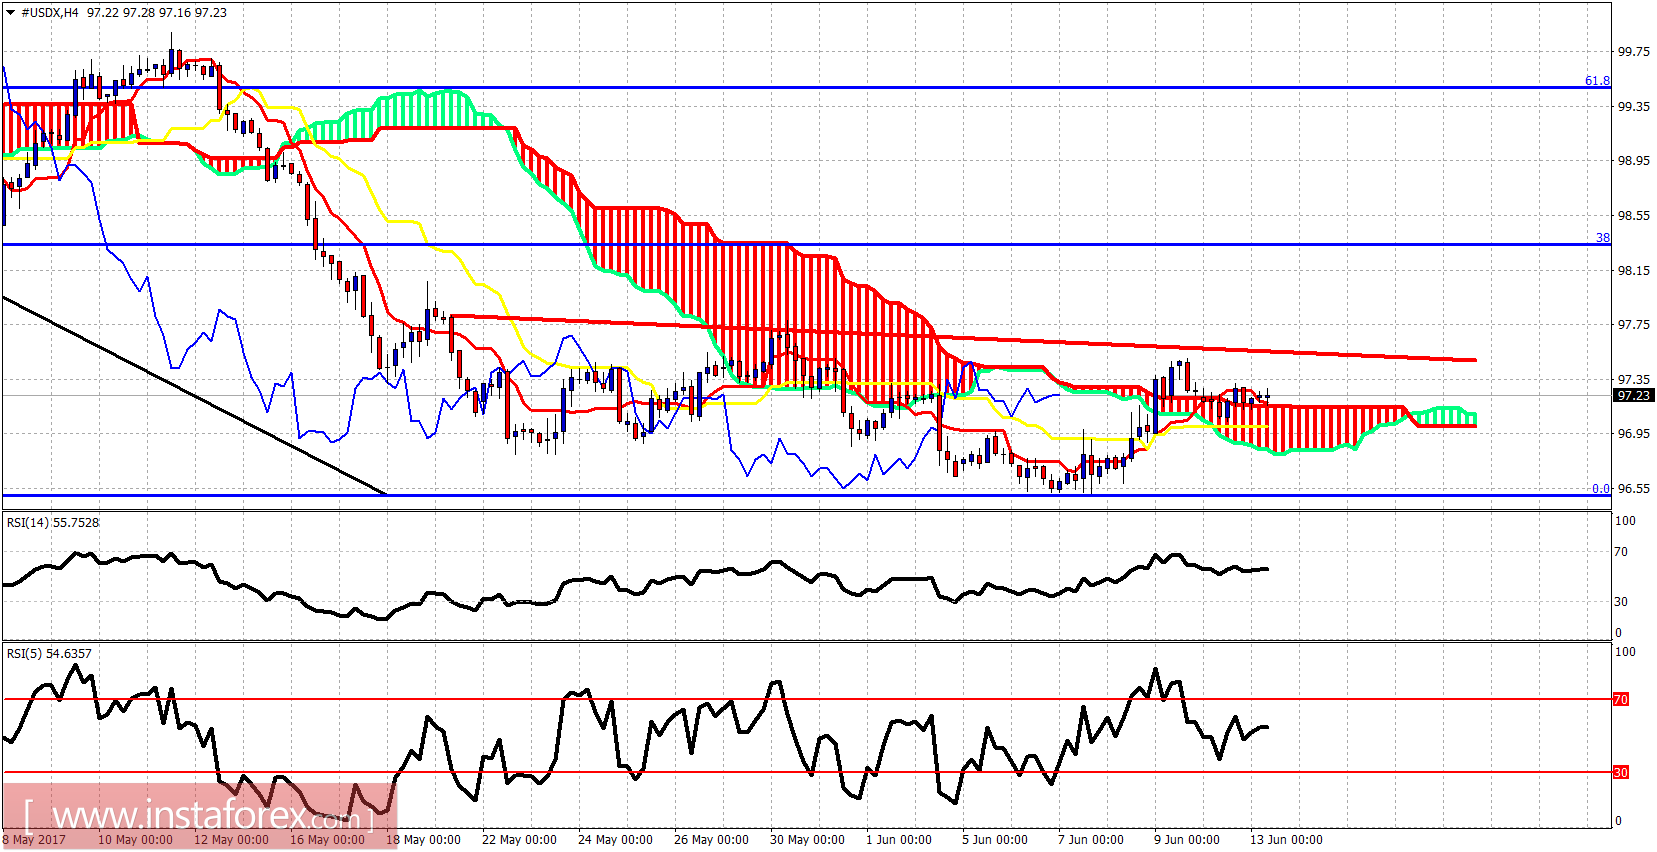
The Dollar index is trying to break above and remain above the 4-hour Kumo (cloud). Short-term trend has changed to bullish and short-term support is at 97 where the 4-hour kijun-sen is found. Resistance is at 97.50. If broken, we will have started the move to 98.50-99.
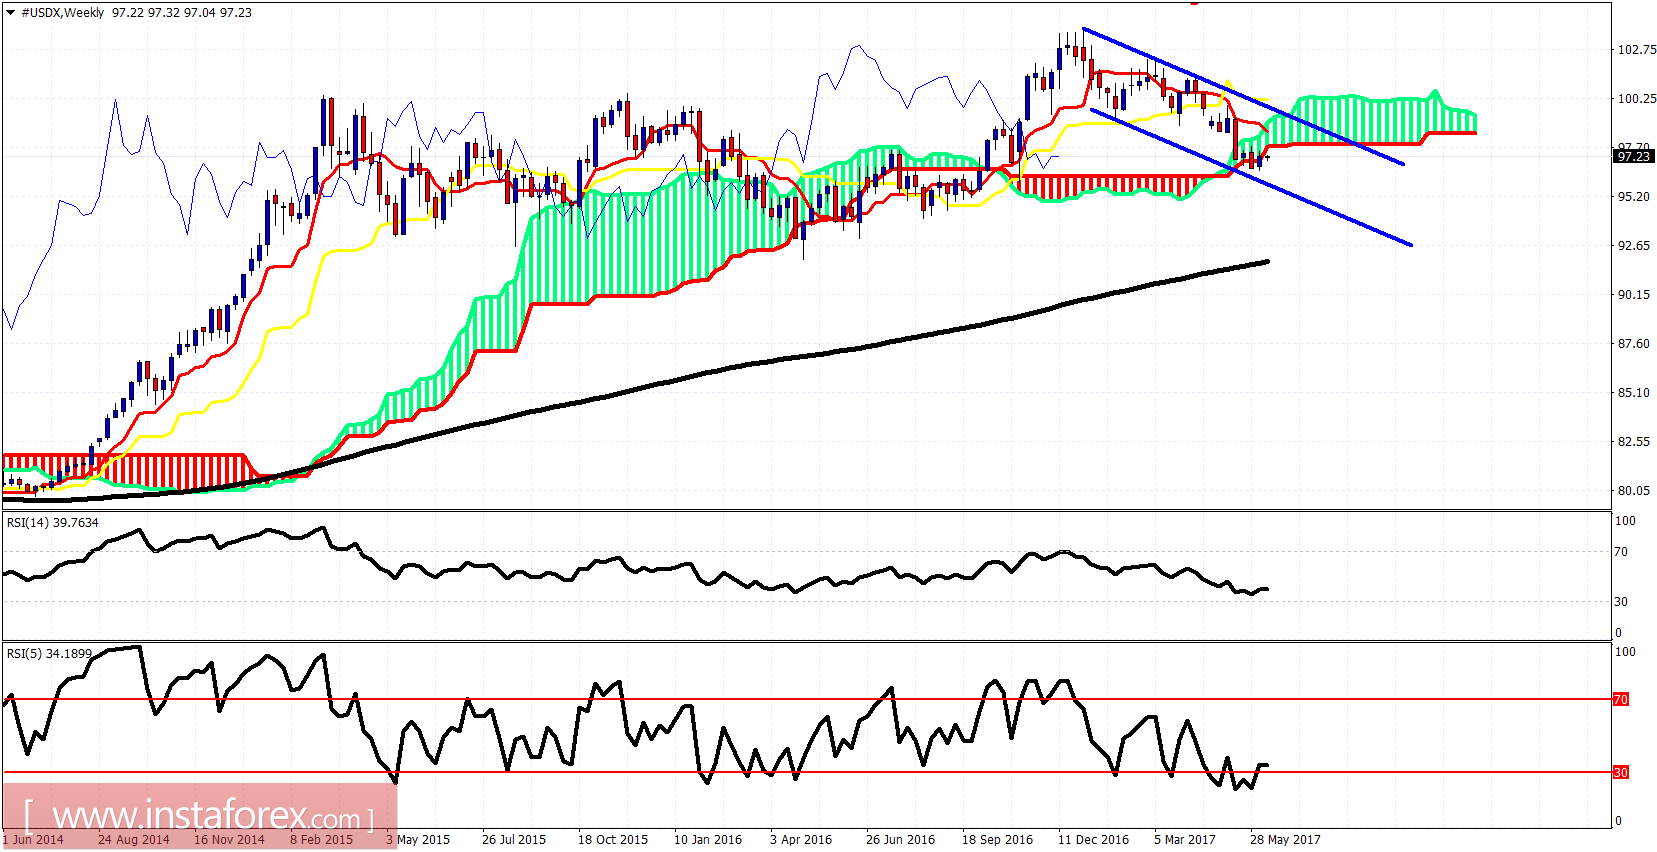
The Dollar index has broken below the weekly Kumo. Weekly trend is bearish. However, I would expect a bounce back inside the Kumo and towards the upper channel boundary or at least the lower cloud boundary at 98. I remain short-term bullish about the Dollar index.