 English
  Русский
 Bahasa Indonesia
 Bahasa Malay
 ไทย
ไทย Español
 Deutsch
 Български
 Français
 Tiếng Việt
 中文
中文 বাংলা
বাংলা हिन्दी
 Čeština
 Українська
 Română

GBP/USD gained momentum during Tuesday's session ahead of Fed meeting, as the pair was favored by a recovery move held since Monday. The resistance zone of 1.2753 still provides a good hurdle for buyers but if the pair manages to break above that level, then we might expect a rally towards 1.2826. MACD indicator is in the overbought territory.
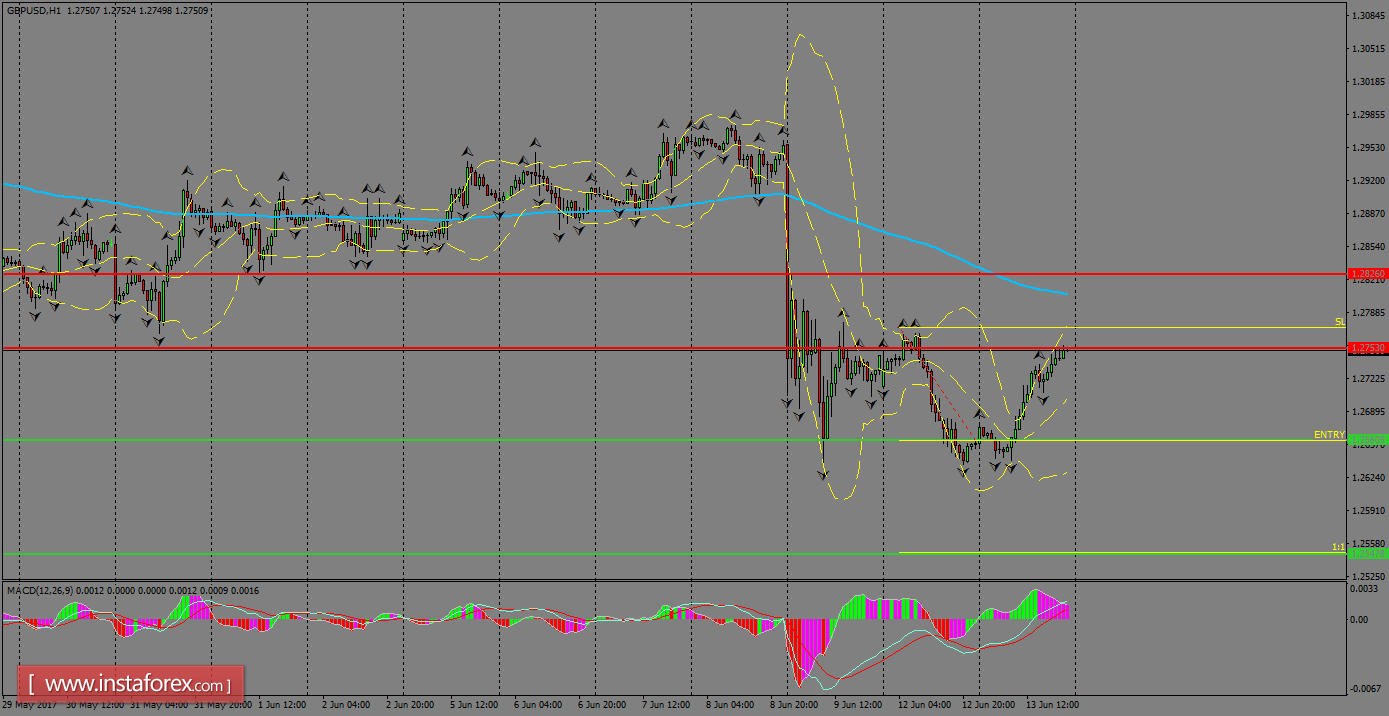
H1 chart's resistance levels: 1.2753 / 1.2826
H1 chart's support levels: 1.2660 / 1.2547
Trading recommendations for today: Based on the H1 chart, sell (short) orders only if the GBP/USD pair breaks a bearish candlestick; the support level is at 1.2660, take profit is at 1.2547 and stop loss is at 1.2773.