 English
  Русский
 Bahasa Indonesia
 Bahasa Malay
 ไทย
ไทย Español
 Deutsch
 Български
 Français
 Tiếng Việt
 中文
中文 বাংলা
বাংলা हिन्दी
 Čeština
 Українська
 Română

USDX continues with the corrective move that started during June 9th session and it's now finding support around 96.95. The 200 SMA at the H1 chart is acting as dynamic support and it might bring some momentum in order to reach the resistance level of 97.41. If the index manages to break above that area, then it can test the 97.75 level.
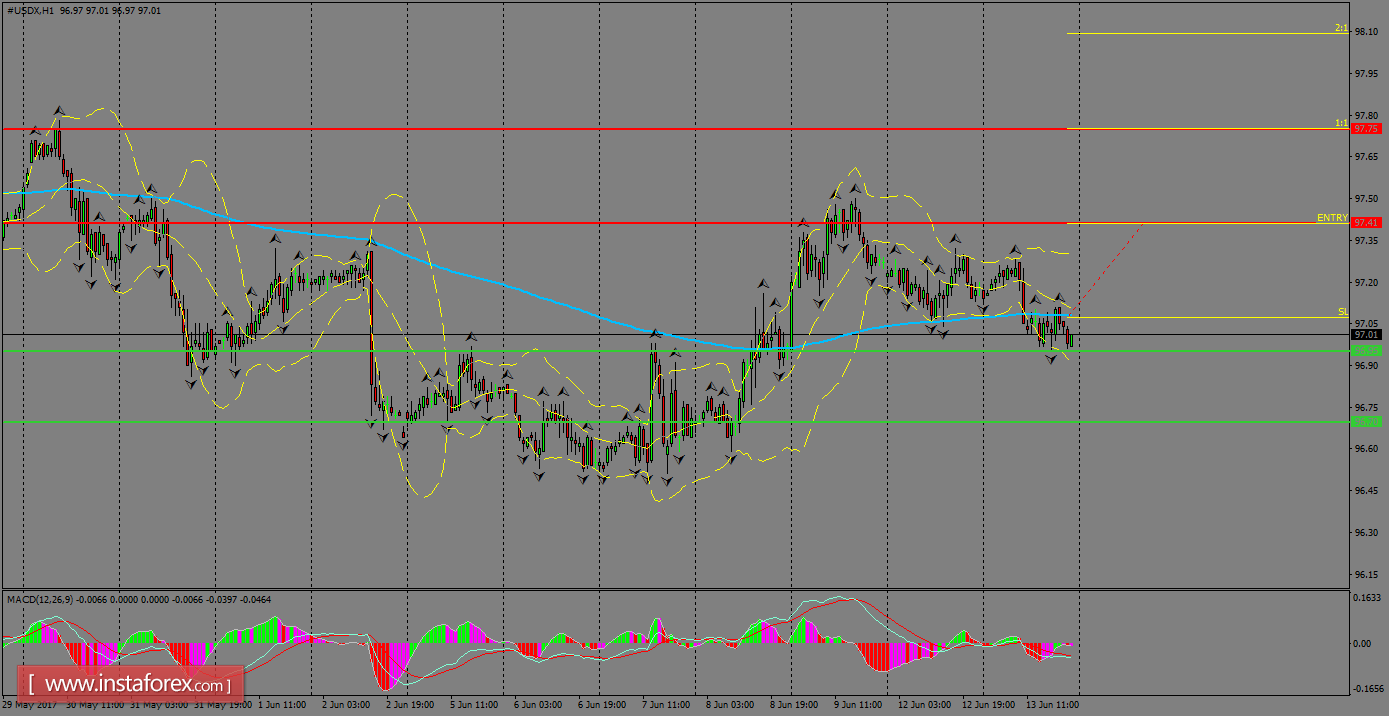
H1 chart's resistance levels: 97.41 / 97.75
H1 chart's support levels: 96.95 / 96.70
Trading recommendations for today: Based on the H1 chart, place buy (long) orders only if the USD Index breaks with a bullish candlestick; the resistance level is at 97.41, take profit is at 97.75 and stop loss is at 97.07.