 English
  Русский
 Bahasa Indonesia
 Bahasa Malay
 ไทย
ไทย Español
 Deutsch
 Български
 Français
 Tiếng Việt
 中文
中文 বাংলা
বাংলা हिन्दी
 Čeština
 Українська
 Română

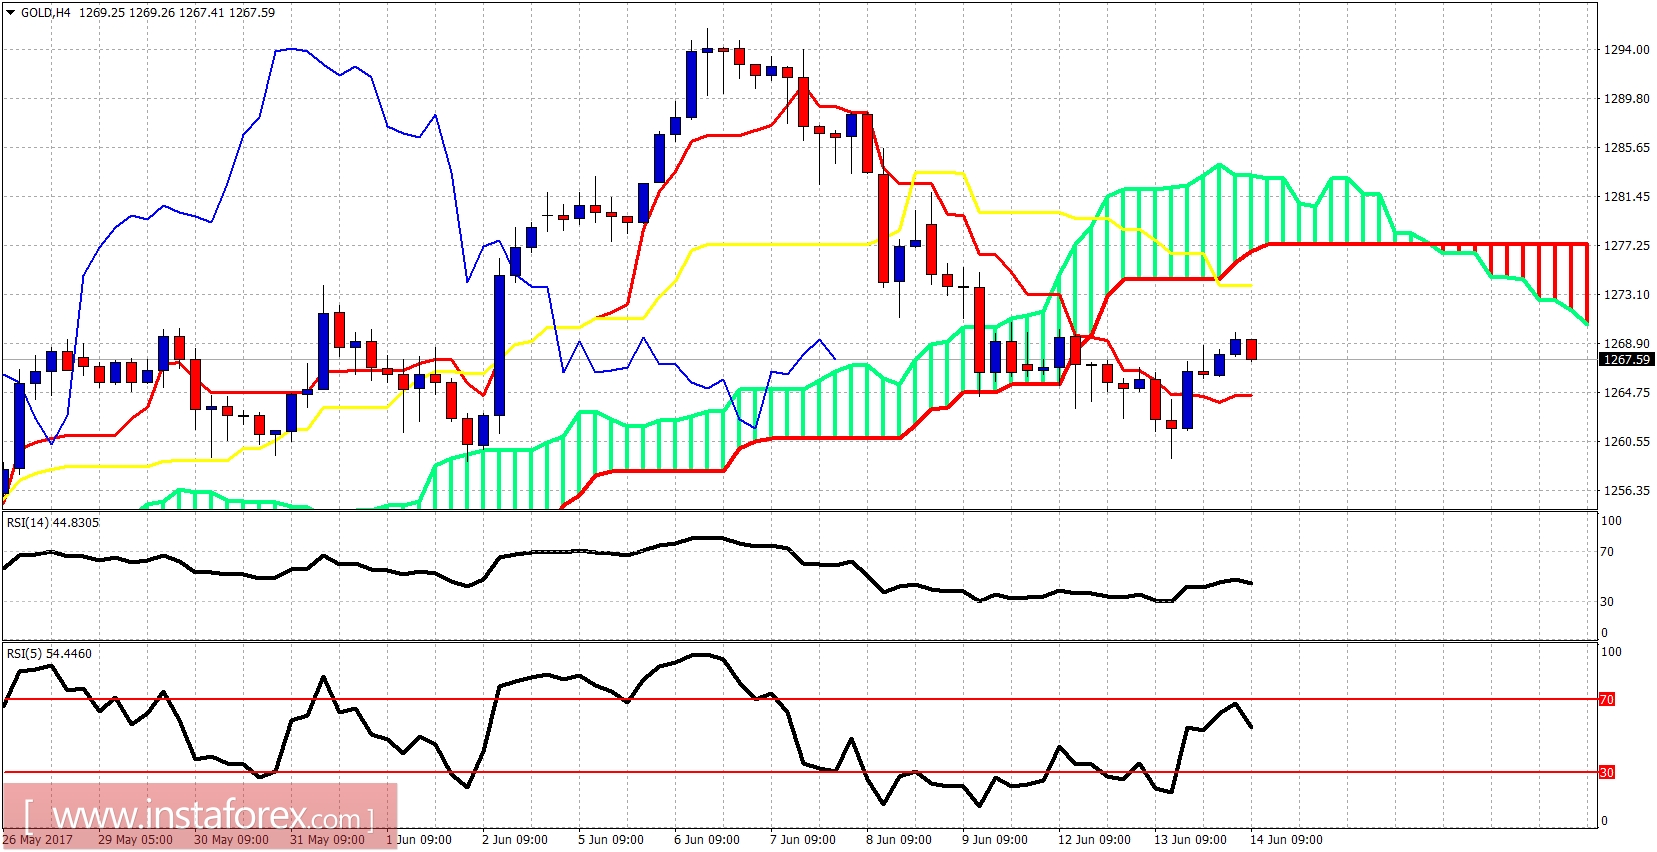
Gold price is bouncing as expected after breaking out of the bearish short-term channel. The trend remains bearish but we could already have completed the entire correction and the next leg up towards $1,400 starting now. It is important to hold the recent low at $1,259.
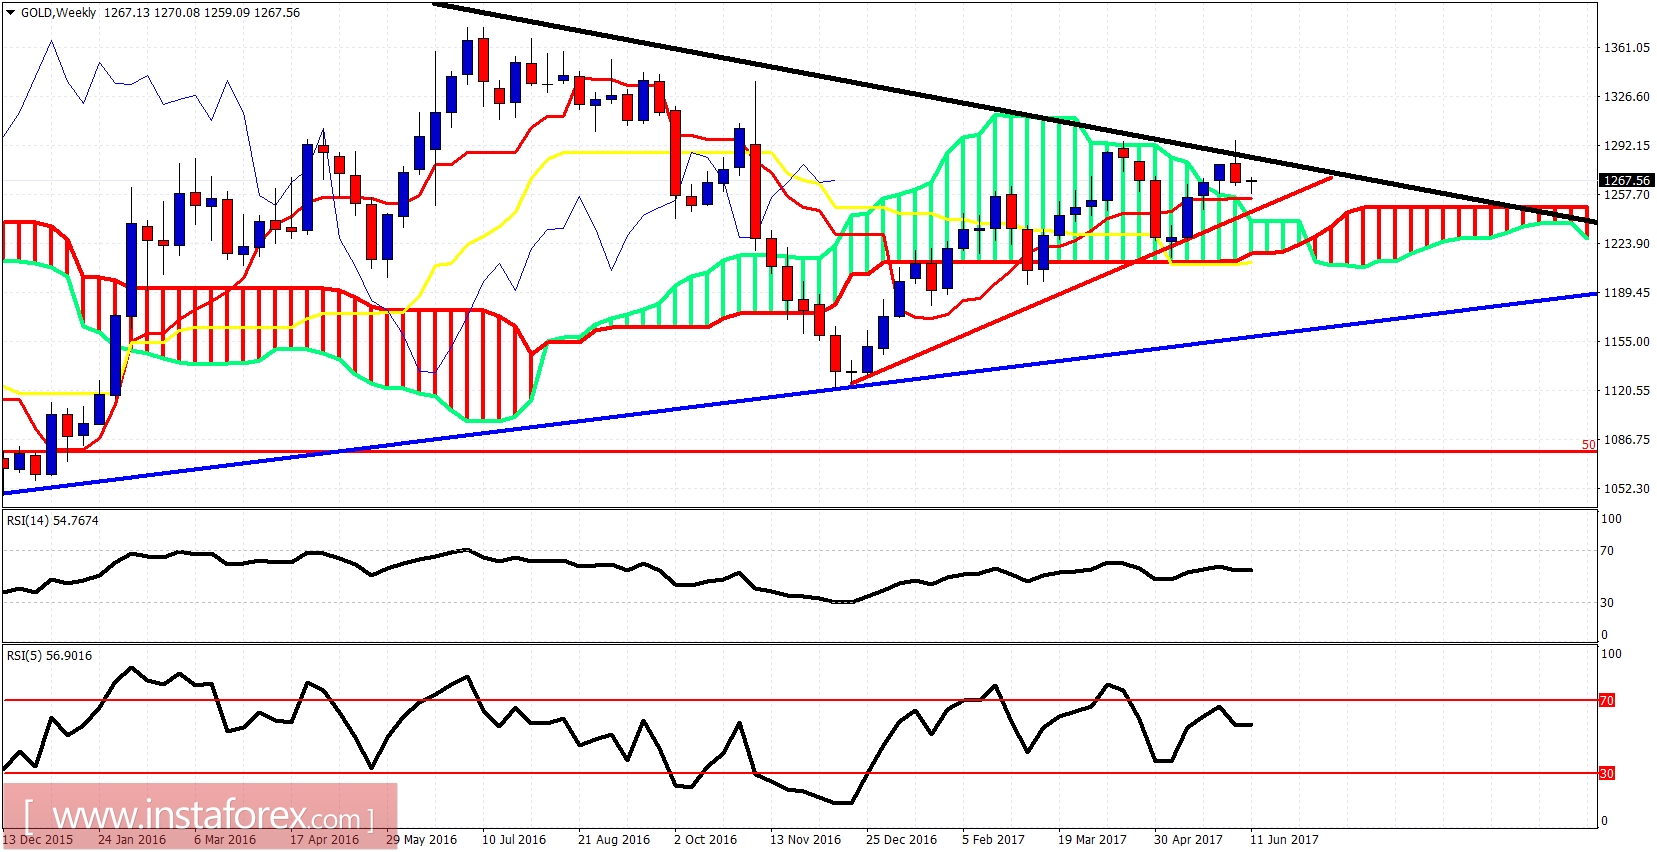
Blue line- long-term support
Black line - long-term resistance
The weekly chart remains slightly bullish as the price is above the weekly Kumo. However, we need to be cautious as the price is still below the long-term black trend line resistance. Holding above the red trend line is a good sign and I do not expect to break it. I was expecting to touch the weekly cloud but it is not necessary. My long-term view remains bullish even if we dip to $1,240-$1,200.