 English
  Русский
 Bahasa Indonesia
 Bahasa Malay
 ไทย
ไทย Español
 Deutsch
 Български
 Français
 Tiếng Việt
 中文
中文 বাংলা
বাংলা हिन्दी
 Čeština
 Українська
 Română

The index crashed early in the Wednesday's morning following bad data in the U.S. but in the afternoon, it managed to cut losses after the Fed decided to hike rates by 25 bps and now it's retesting the 200 SMA at H1 chart. If we see a consolidation over there, then we can expect a rally towards 97.41. MACD indicator is turning oversold, favoring to a rebound.
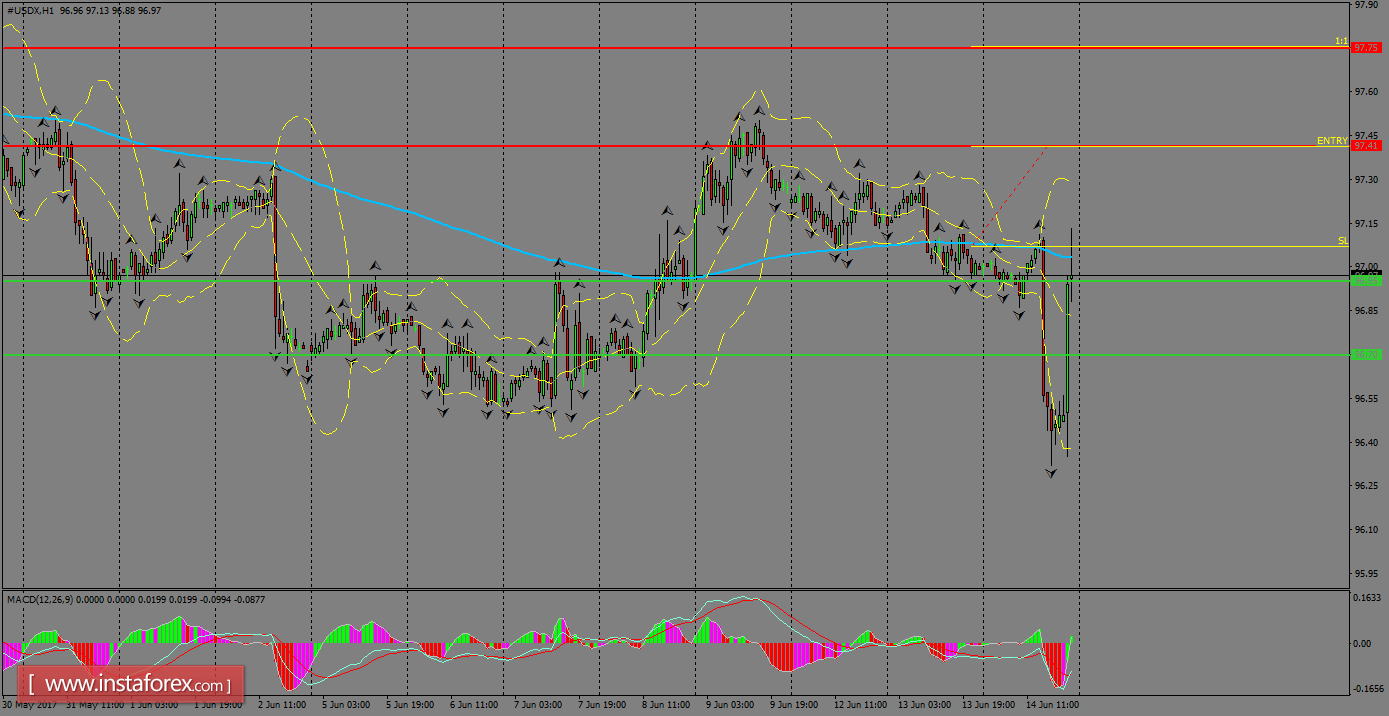
H1 chart's resistance levels: 97.41 / 97.75
H1 chart's support levels: 96.95 / 96.70
Trading recommendations for today: Based on the H1 chart, place buy (long) orders only if the USD Index breaks with a bullish candlestick; the resistance level is at 97.41, take profit is at 97.75 and stop loss is at 97.07.