 English
  Русский
 Bahasa Indonesia
 Bahasa Malay
 ไทย
ไทย Español
 Deutsch
 Български
 Français
 Tiếng Việt
 中文
中文 বাংলা
বাংলা हिन्दी
 Čeština
 Українська
 Română

The index trimmed gains and it's being supported by the 200 SMA at H1 chart. So far, we're expecting the upside continuation in the greenback, but in case that we witness a breakout below 96.95, then further declines are expected to take place towards 96.70 in a first degree, while a consolidation above Friday's highs should take USDX to test the 97.75 level.
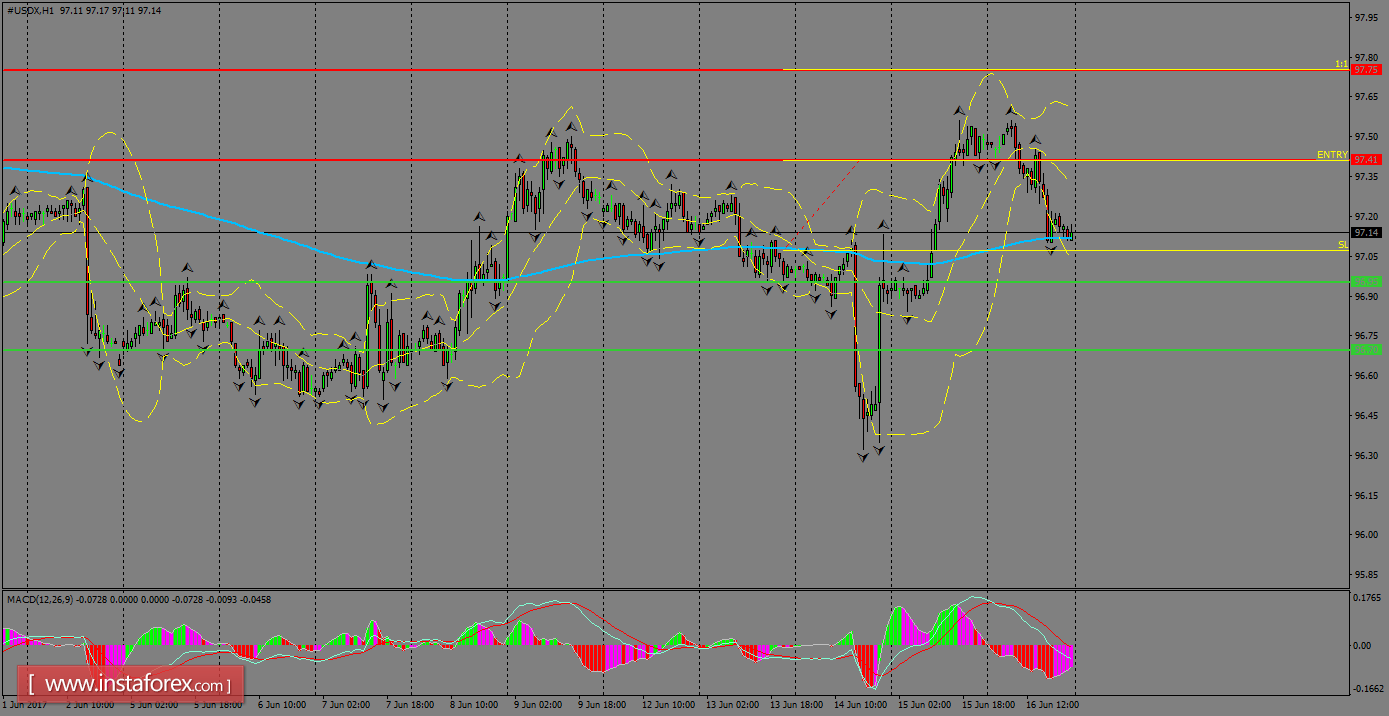
H1 chart's resistance levels: 97.41 / 97.75
H1 chart's support levels: 96.95 / 96.70
Trading recommendations for today: Based on the H1 chart, place buy (long) orders only if the USD Index breaks with a bullish candlestick; the resistance level is at 97.41, take profit is at 97.75 and stop loss is at 97.07.