 English
  Русский
 Bahasa Indonesia
 Bahasa Malay
 ไทย
ไทย Español
 Deutsch
 Български
 Français
 Tiếng Việt
 中文
中文 বাংলা
বাংলা हिन्दी
 Čeština
 Українська
 Română

Gold price is breaking short-term support and is heading towards our target of $1,245. Gold weakness is expected for the start of the week but overall I can see a bigger longer-term upward reversal coming soon.
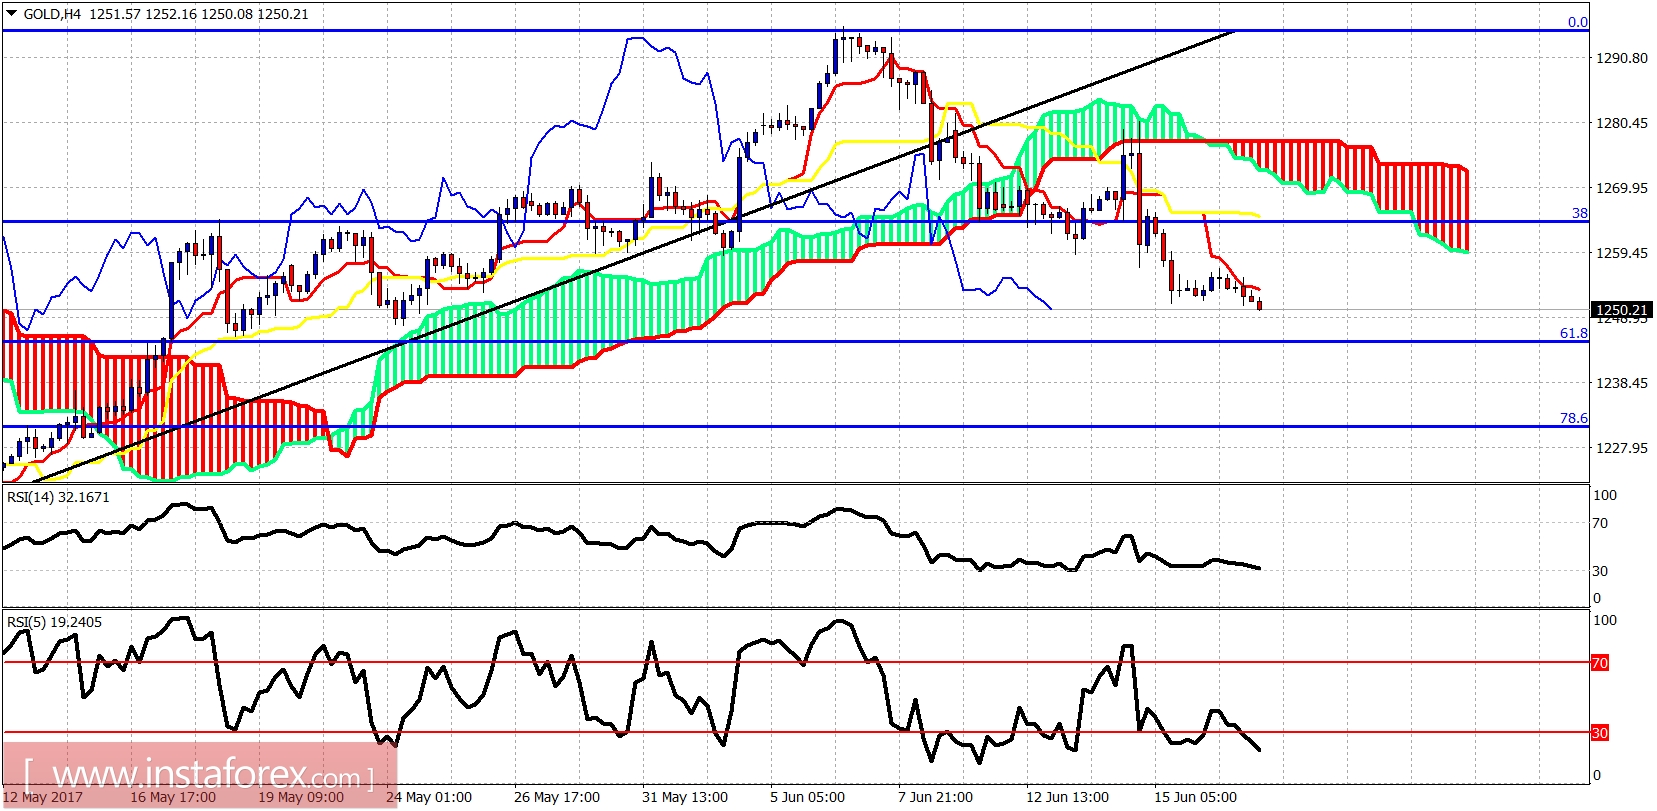
Red line - support trend line
Blue line - long-term support trend line
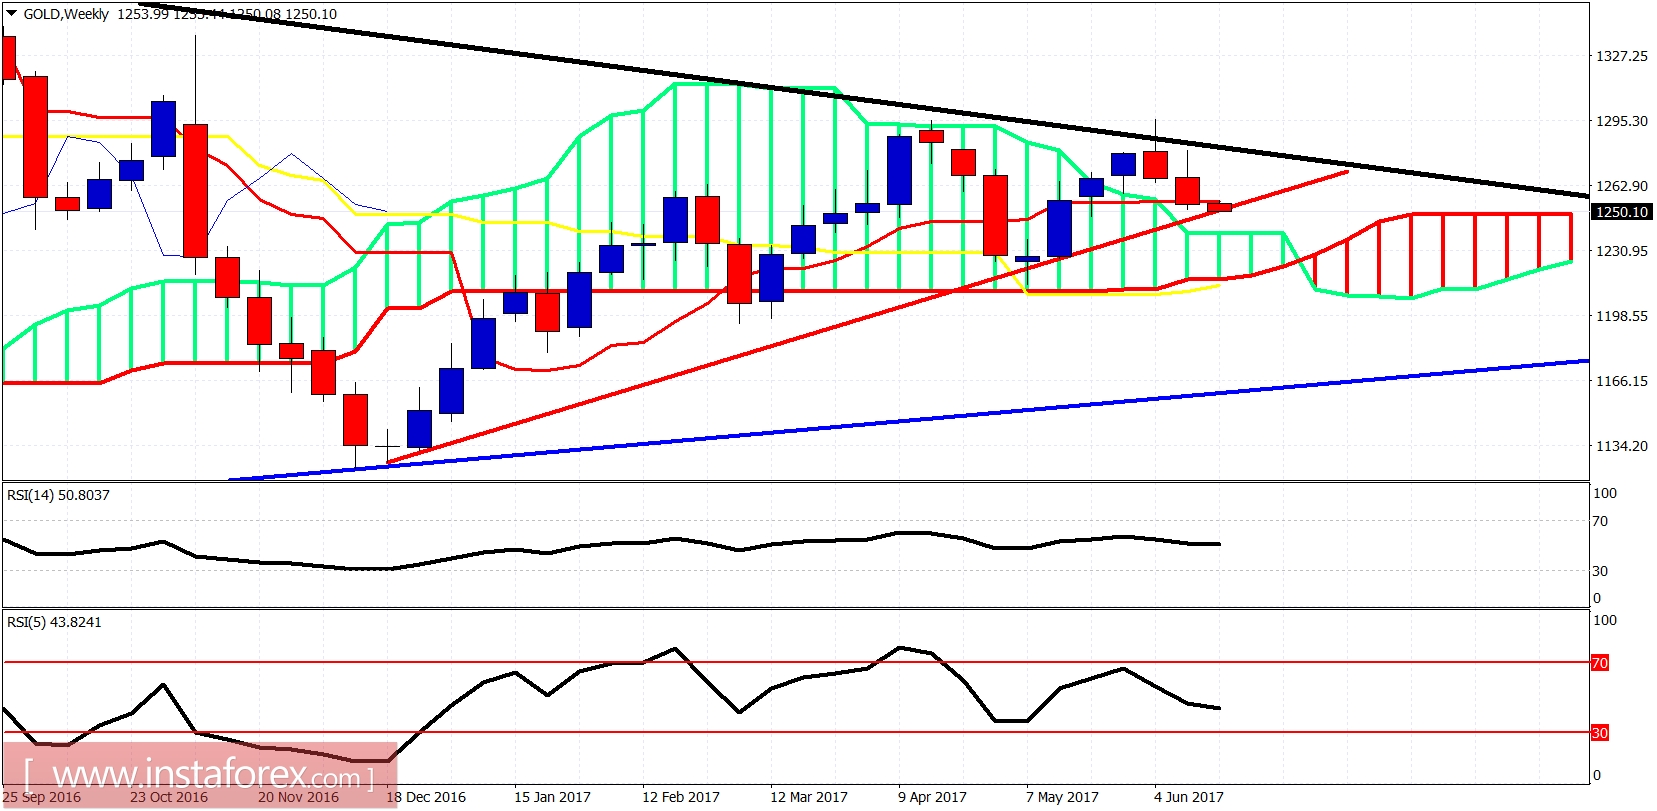
The Gold weekly chart as expected is moving towards the weekly Kumo (cloud) support at $1,235-45 area. The rejection unfolded as we expected two weeks ago at $1,295. Now we prepare for a longer-term reversal. I expect Gold to reverse upwards from the $1,200-$1,245 area. I remain longer-term bullish.