 English
  Русский
 Bahasa Indonesia
 Bahasa Malay
 ไทย
ไทย Español
 Deutsch
 Български
 Français
 Tiếng Việt
 中文
中文 বাংলা
বাংলা हिन्दी
 Čeština
 Українська
 Română

The Dollar index bounced off support yesterday as we expected and is trying to break above the 97.50 short-term resistance. This will mean that the move towards 98.50 we were expecting has started.
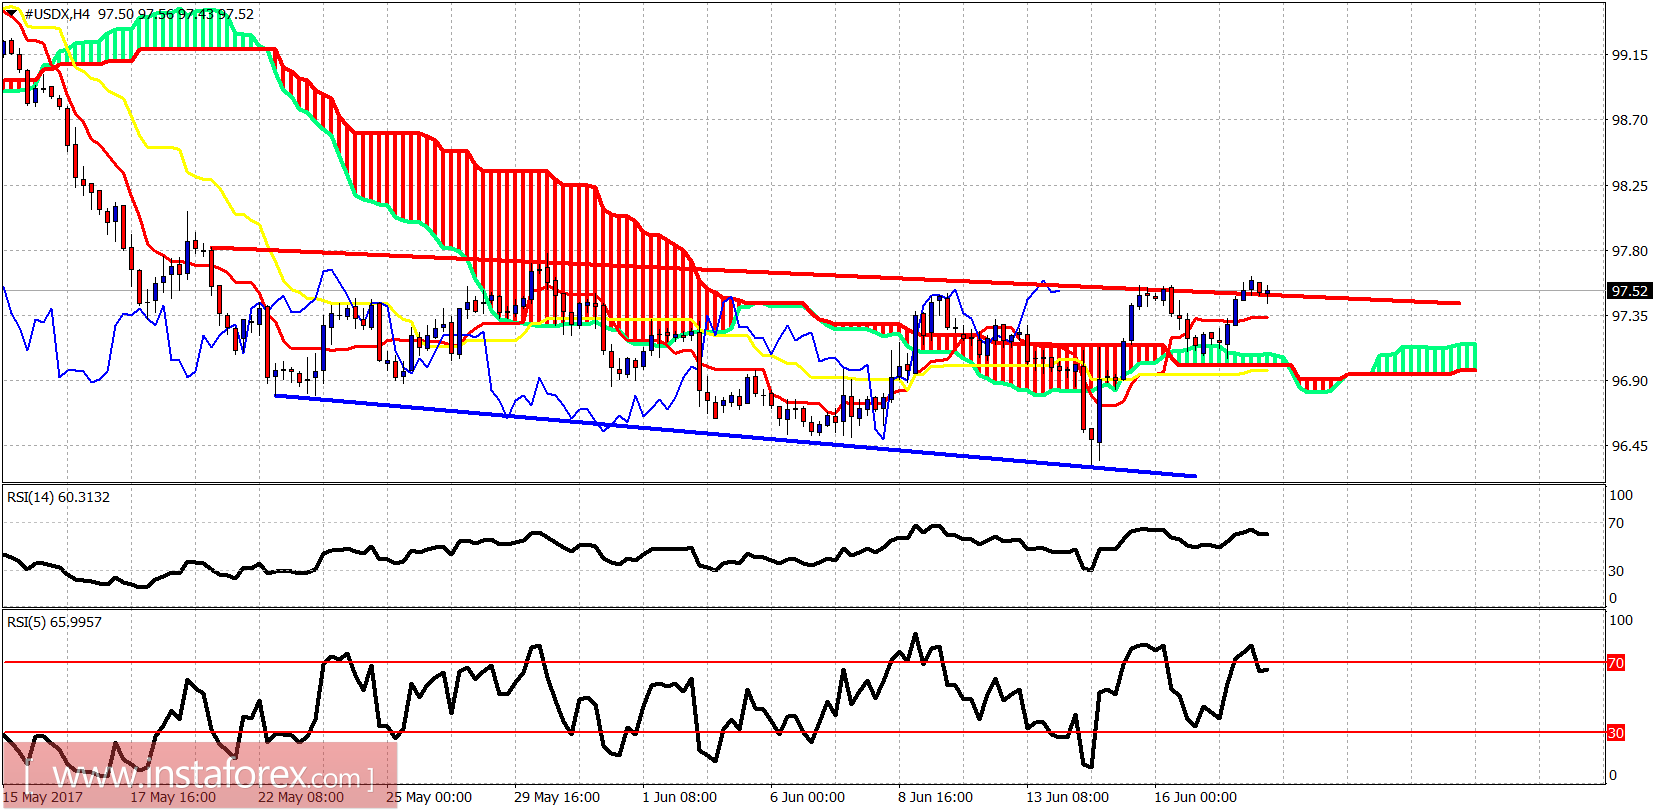
Blue line - support
The Dollar index bounced off the short-term cloud support and is trying to break above resistance. Trend is neutral as the index has been trading in a range for several weeks. Short-term support is at 97. Resistance at 97.50-97.60.
Red line - resistance trend line
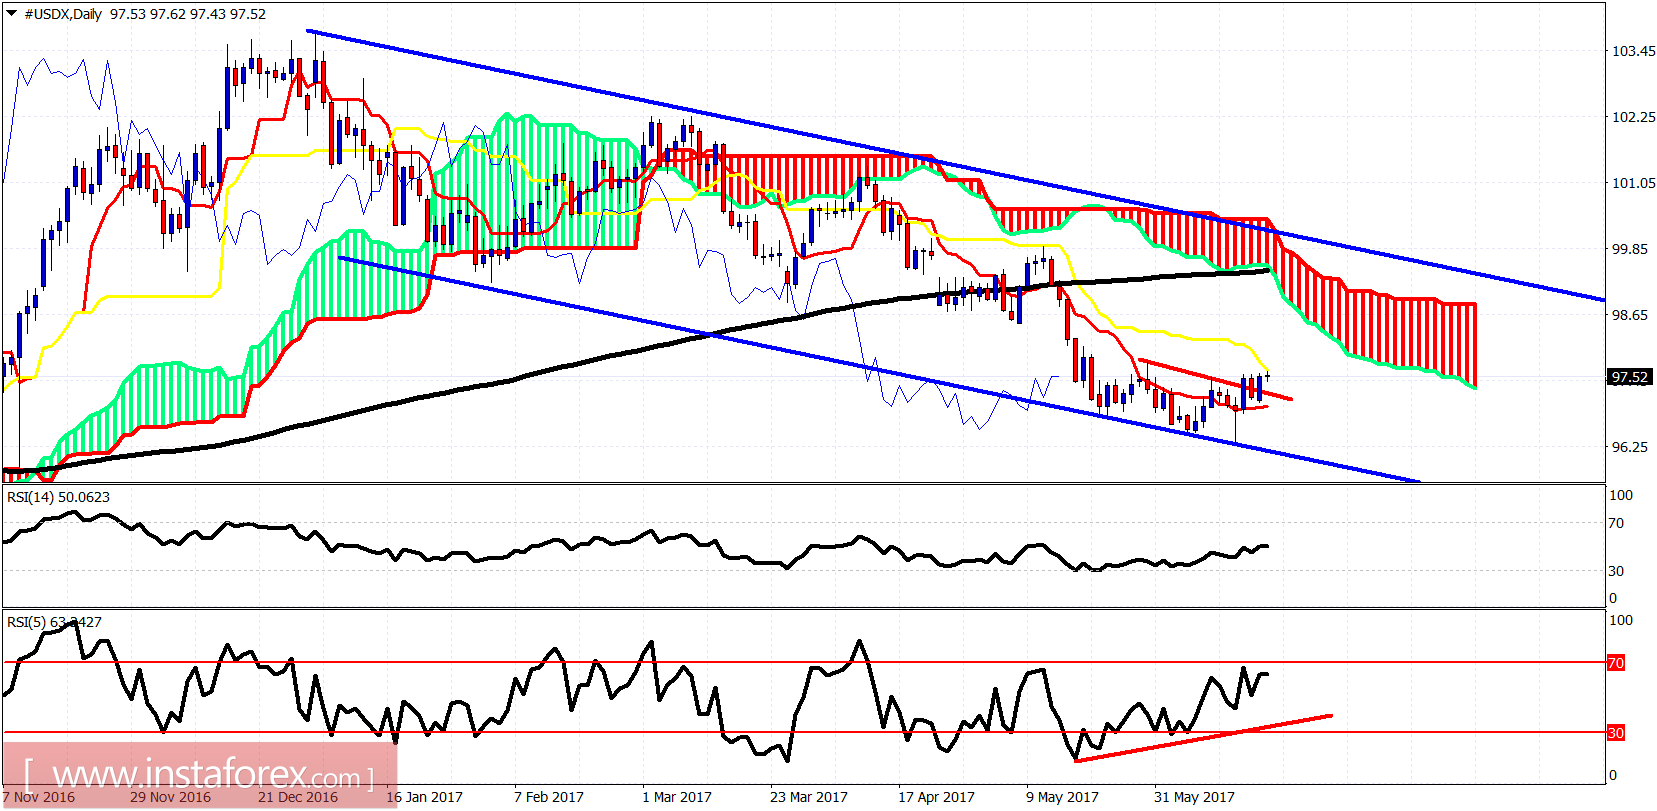
The Dollar index is diverging in the daily chart and is bouncing off the lower channel boundary. I still expect price to move towards the daily Kumo at least near 98.30-98.50. It is also possible to reach the upper channel boundary. To sum up, I remain bullish about the US dollar at least for the short term.