 English
  Русский
 Bahasa Indonesia
 Bahasa Malay
 ไทย
ไทย Español
 Deutsch
 Български
 Français
 Tiếng Việt
 中文
中文 বাংলা
বাংলা हिन्दी
 Čeština
 Українська
 Română

The pair has been consolidating below the 200 SMA, as the bears continue to pressure on the Cable's price. Overall, all price action points to the downside, but if the resistance level of 1.2704 gives up on the current recovery, we might expect a continuation towards 1.2826 in a first degree. MACD indicator remains overbought, supporting the downside's scenario.
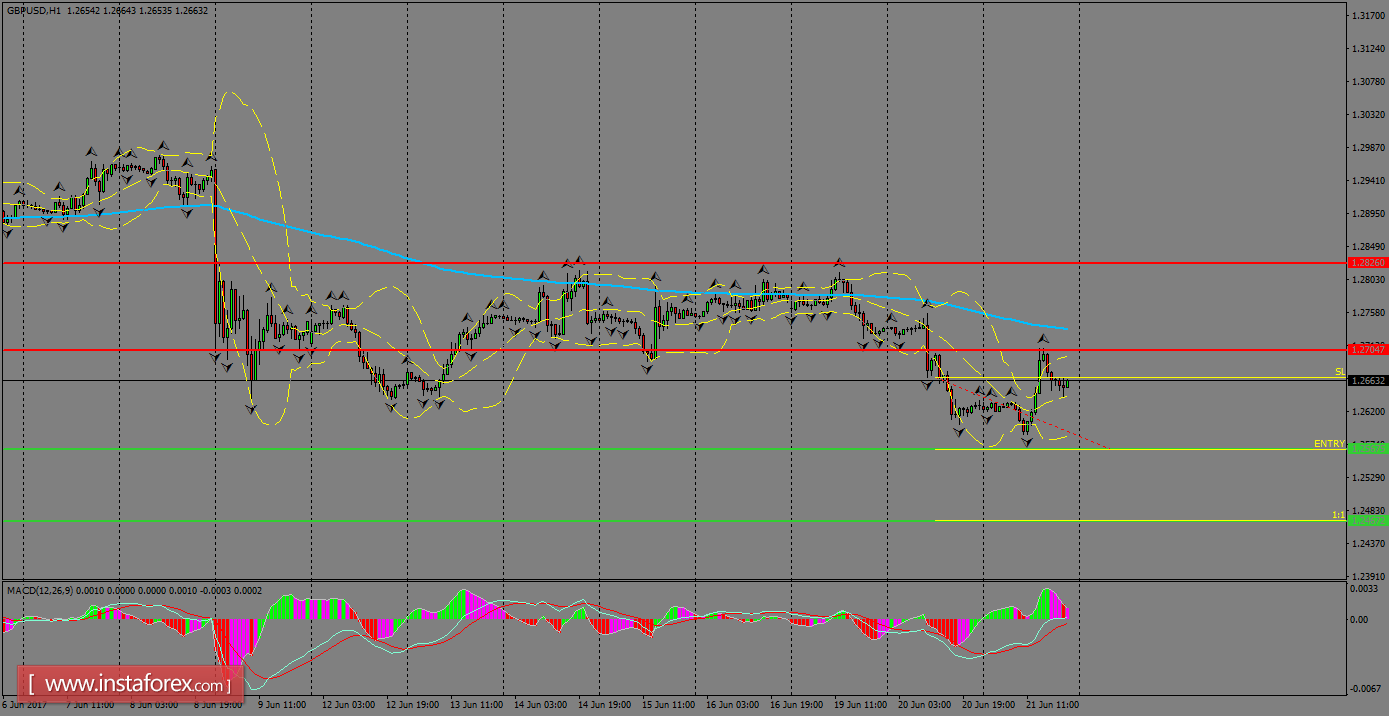
H1 chart's resistance levels: 1.2704 / 1.2826
H1 chart's support levels: 1.2567 / 1.2467
Trading recommendations for today: Based on the H1 chart, sell (short) orders only if the GBP/USD pair breaks a bearish candlestick; the support level is at 1.2567, take profit is at 1.2467 and stop loss is at 1.2665.