 English
  Русский
 Bahasa Indonesia
 Bahasa Malay
 ไทย
ไทย Español
 Deutsch
 Български
 Français
 Tiếng Việt
 中文
中文 বাংলা
বাংলা हिन्दी
 Čeština
 Українська
 Română

Bulls have been gathering momentum in the last days, but during Wednesday's session, USDX managed to pull back from the resistance zone of 97.84. If the index manages to break above such barrier, further gains are expected towards 98.18 in a first degree, while a break below the 200 SMA at H1 chart can expose the 97.10 level.
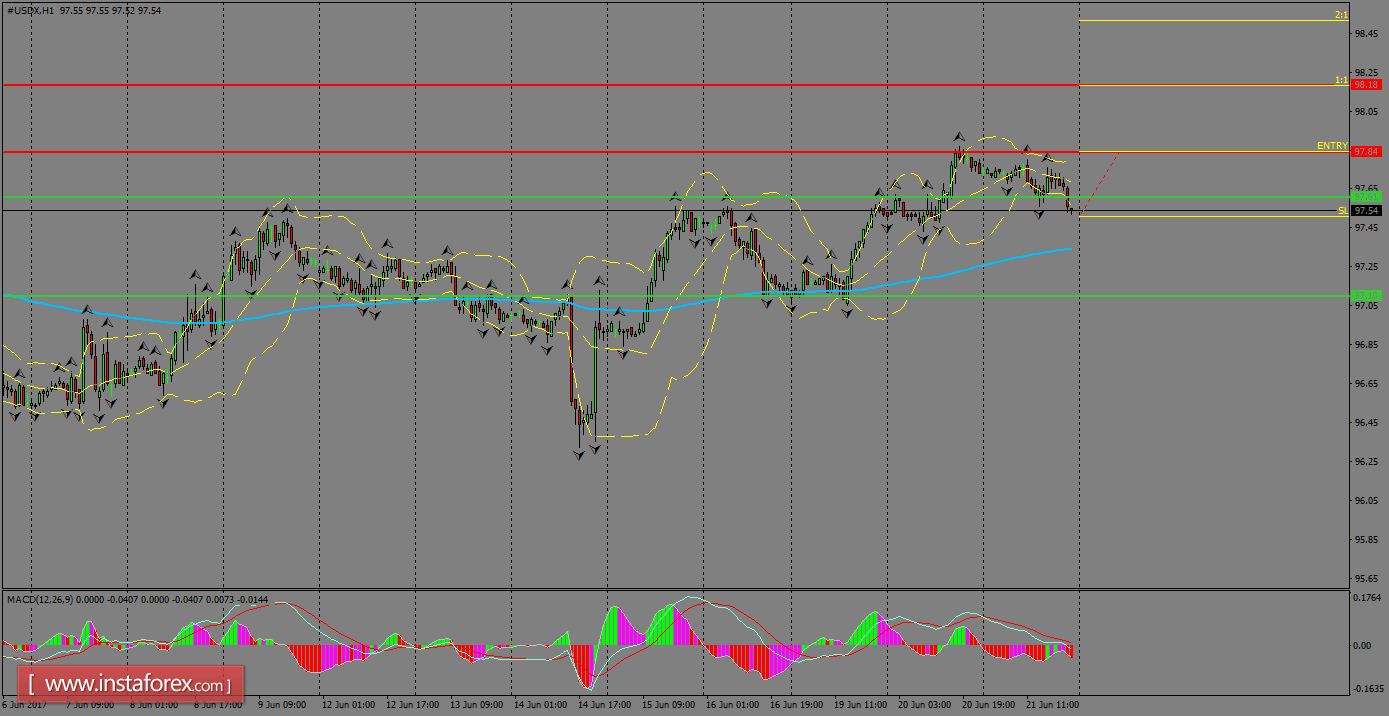
H1 chart's resistance levels: 97.84 / 98.98
H1 chart's support levels: 97.61 / 97.10
Trading recommendations for today: Based on the H1 chart, place buy (long) orders only if the USD Index breaks with a bullish candlestick; the resistance level is at 97.84, take profit is at 98.98 and stop loss is at 97.51.