 English
  Русский
 Bahasa Indonesia
 Bahasa Malay
 ไทย
ไทย Español
 Deutsch
 Български
 Français
 Tiếng Việt
 中文
中文 বাংলা
বাংলা हिन्दी
 Čeština
 Українська
 Română

The USD/JPY is approaching some very critical medium-term trend resistance levels. The trend in the short-term remains bullish but the medium-term trend is bearish.
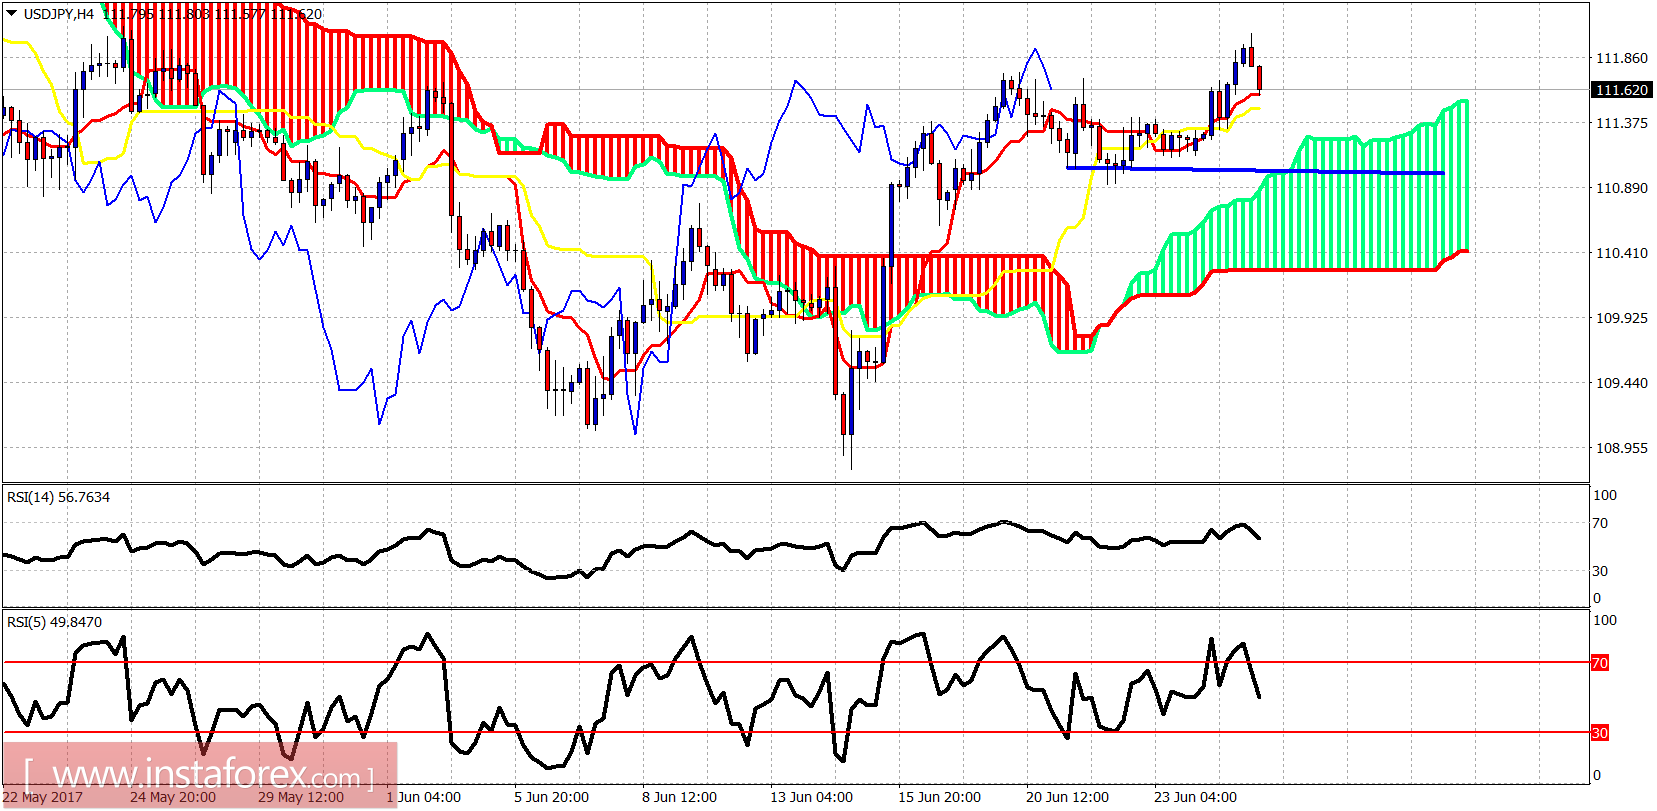
Blue line - short-term support
Short-term support is at 111. The price is above the 4-hour Kumo confirming that the short-term trend is bullish. Only a break below 111 will put this trend into danger and a break below 110.40 will confirm trend change to bearish.
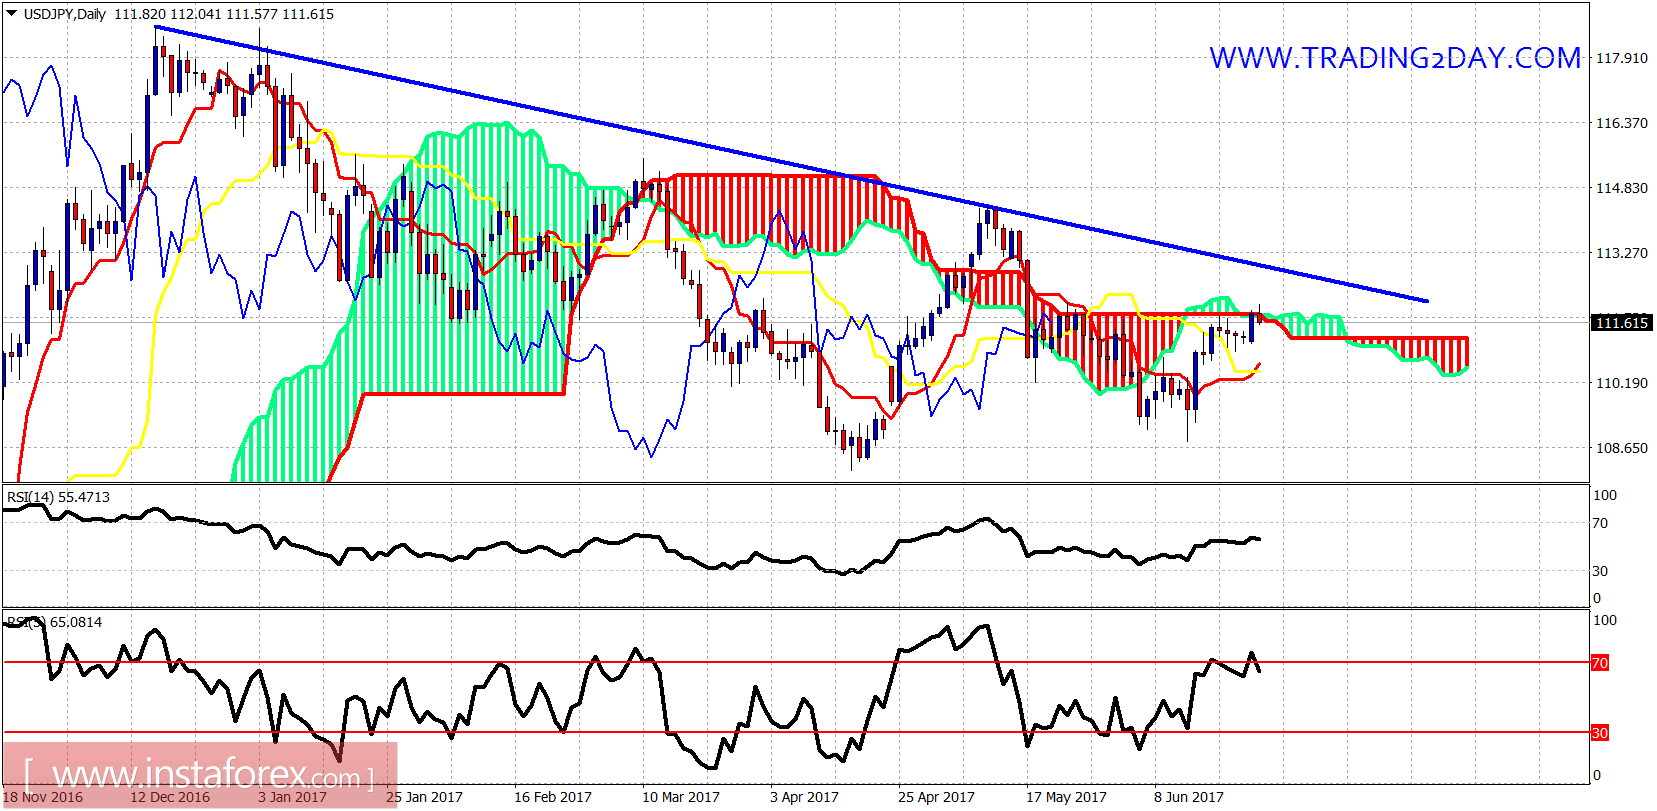
Blue line - long-term resistance
In the Daily chart, the price is trying to break above the Kumo. The price also remains below the long-term Trend line resistance at 112.50. The 111.80-112.50 area is important resistance and we could see a rejection from there.