English
  Русский
 Bahasa Indonesia
 Bahasa Malay
 ไทย
ไทย Español
 Deutsch
 Български
 Français
 Tiếng Việt
 中文
中文 বাংলা
বাংলা हिन्दी
 Čeština
 Українська
 Română

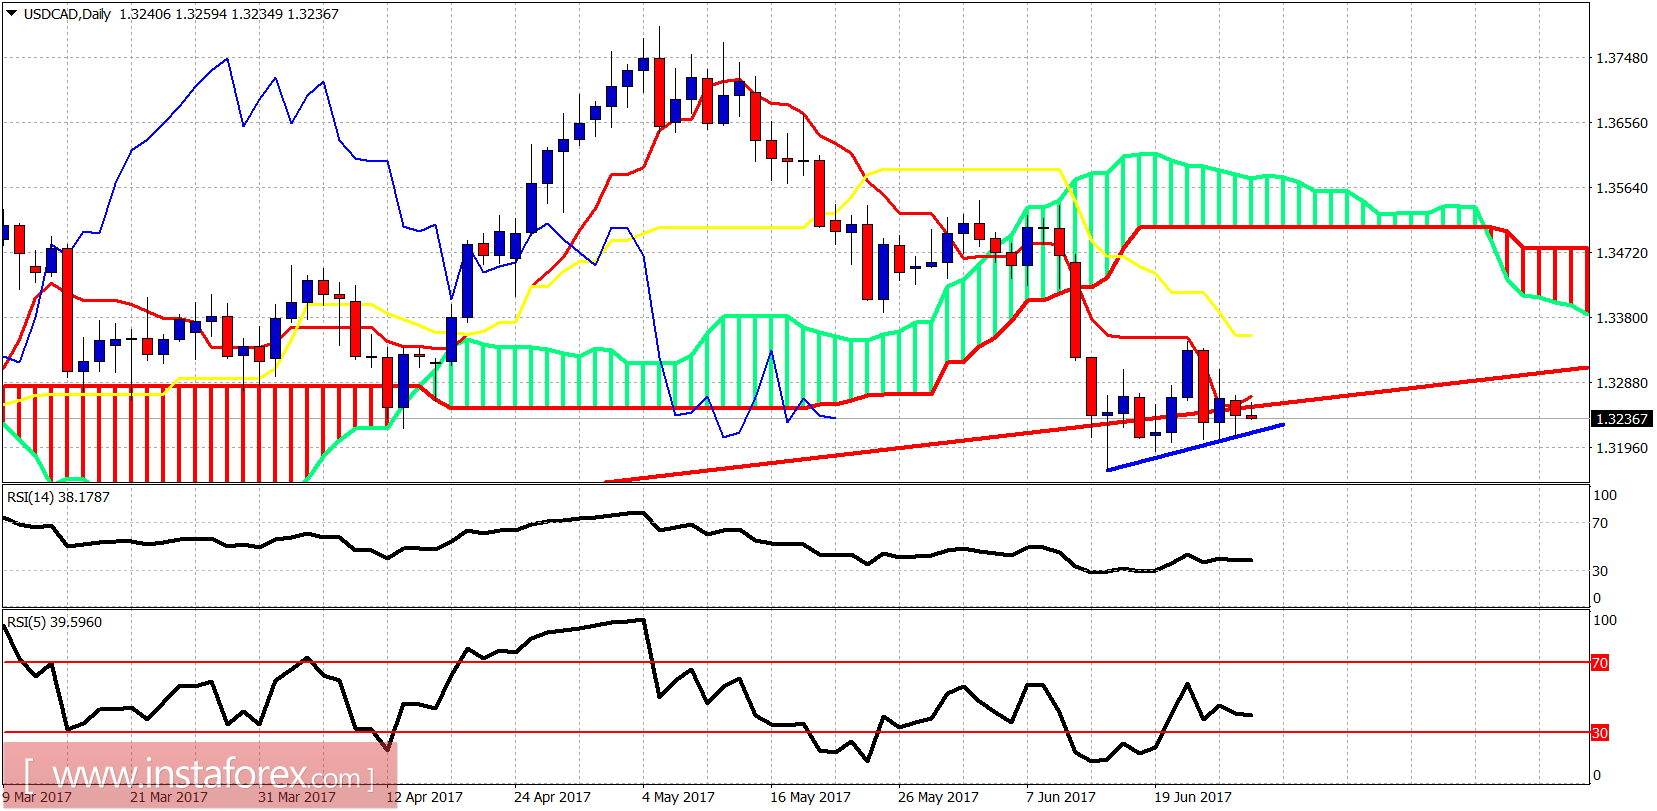
Since June 14th, the USD/CAD has been mainly moving sideways respecting support levels but with no bounce strength despite oil weakness. 1.32 is critical support.
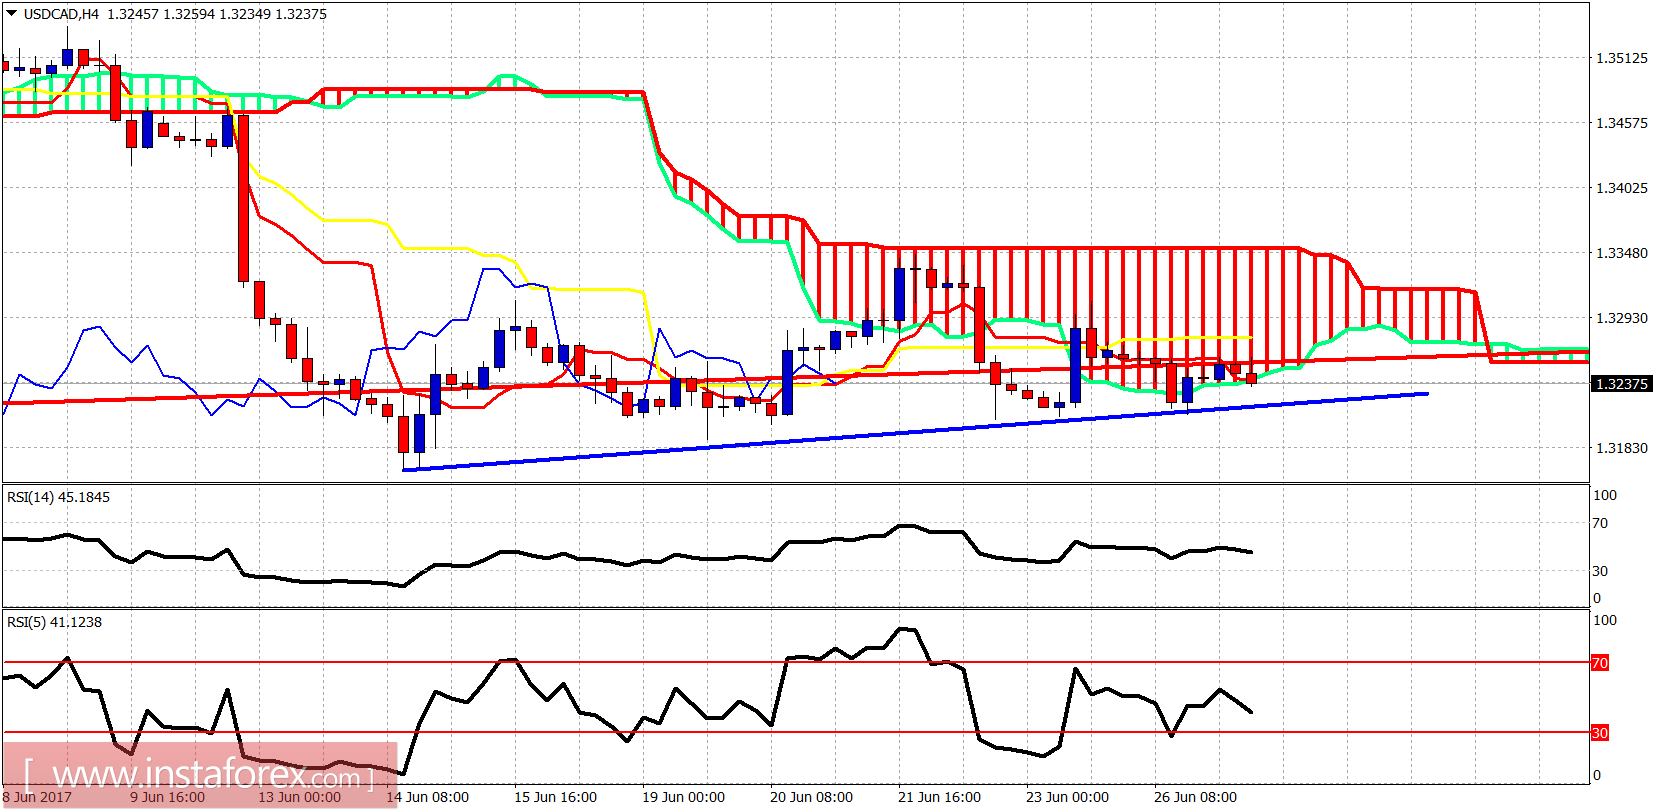
Blue line - short-term support
The USD/CAD pair is trading below the Kumo and this might put another test to the critical support of 1.32. Resistance is at 1.3255 and if broken, we could see a bounce towards 1.3350.