 English
  Русский
 Bahasa Indonesia
 Bahasa Malay
 ไทย
ไทย Español
 Deutsch
 Български
 Français
 Tiếng Việt
 中文
中文 বাংলা
বাংলা हिन्दी
 Čeština
 Українська
 Română

Selling pressure in the US dollar index pushed it below the important resistance levels opening the way for a move towards 95-94. The trend is clearly bearish on all time frames.
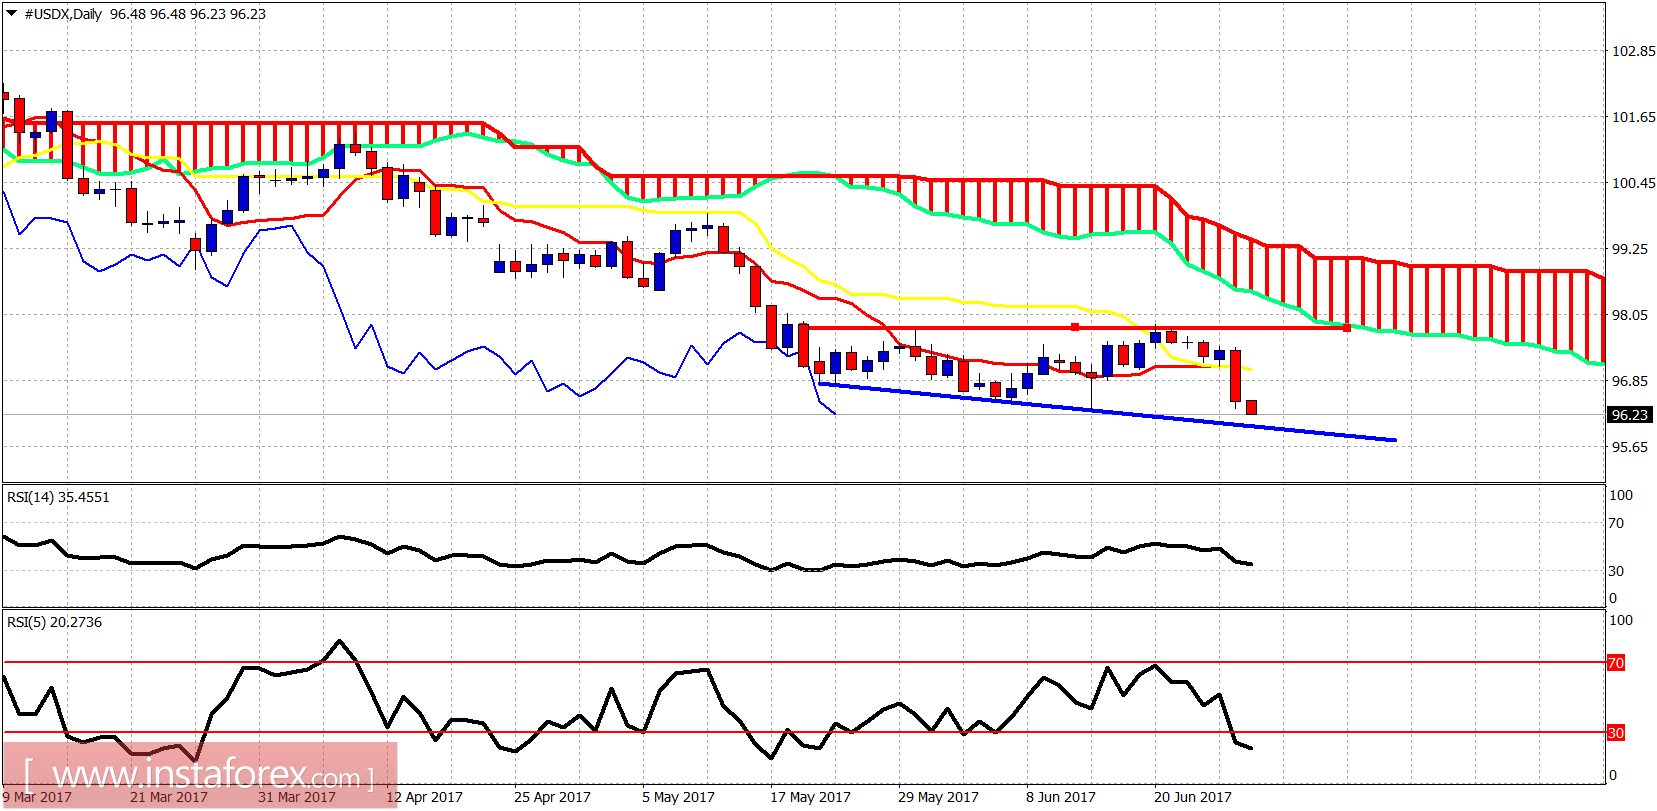
Blue line - support
Price has broken below the Tenkan- and Kijun-Sen on the daily chart. The index has been forming something like a megaphone for the last few weeks and this provides a support at 95.70. However, I believe that the move that started just below 98 last week is not going to stop there but much lower. The consolidation of the last few weeks is being broken downwards.
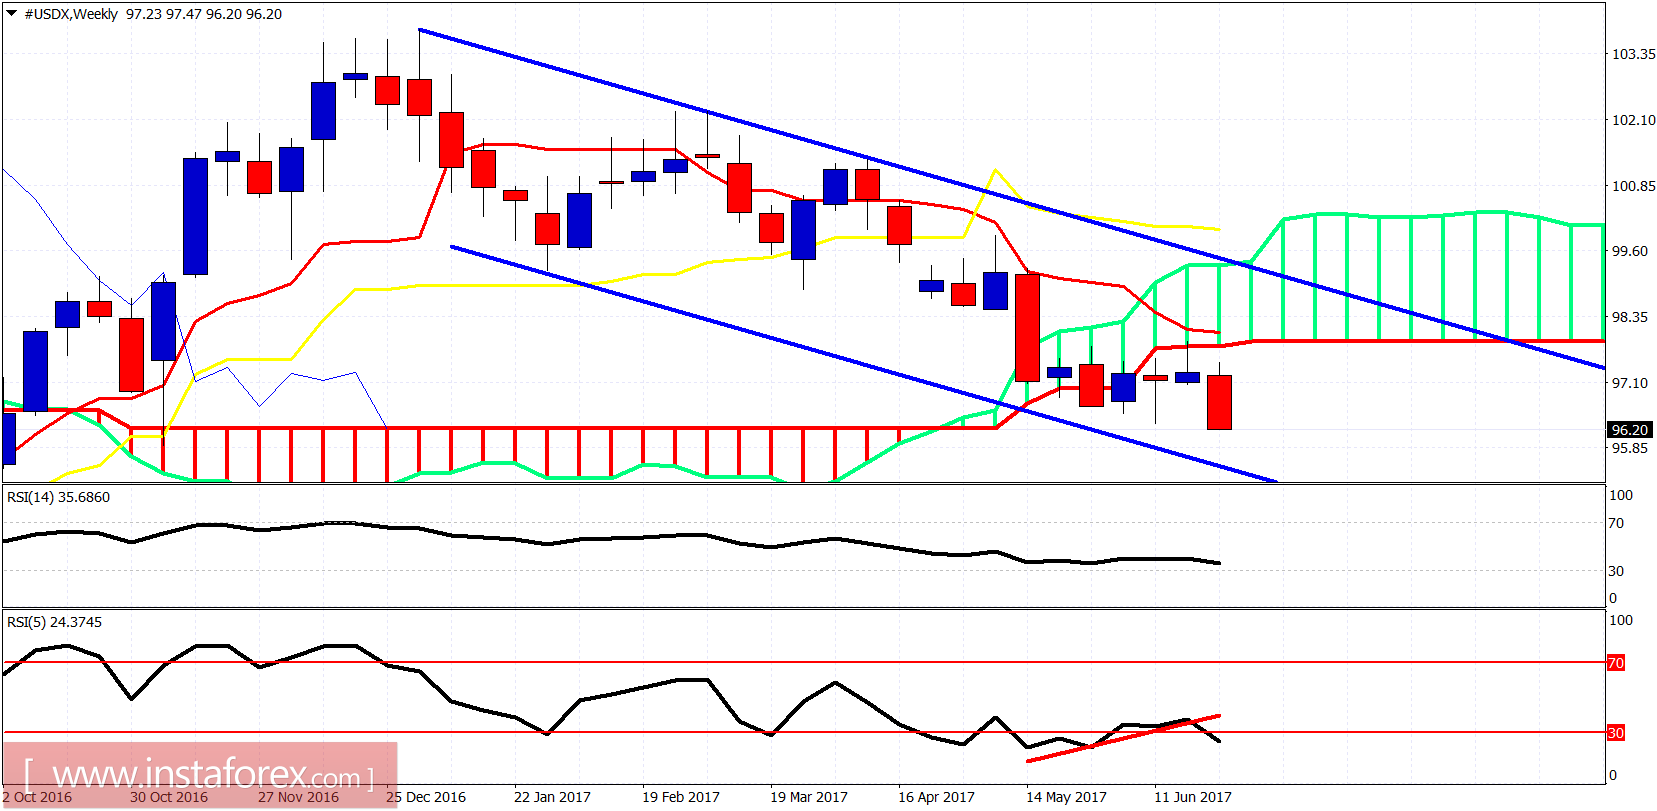
The rejection from the Ichimoku cloud was a stronger bearish signal than the bullish divergence by the RSI(5). The trend remains bearish as a new weekly low is made. We have to wait and see if the RSI indicators provide a new low or a new divergence.