 English
  Русский
 Bahasa Indonesia
 Bahasa Malay
 ไทย
ไทย Español
 Deutsch
 Български
 Français
 Tiếng Việt
 中文
中文 বাংলা
বাংলা हिन्दी
 Čeština
 Українська
 Română

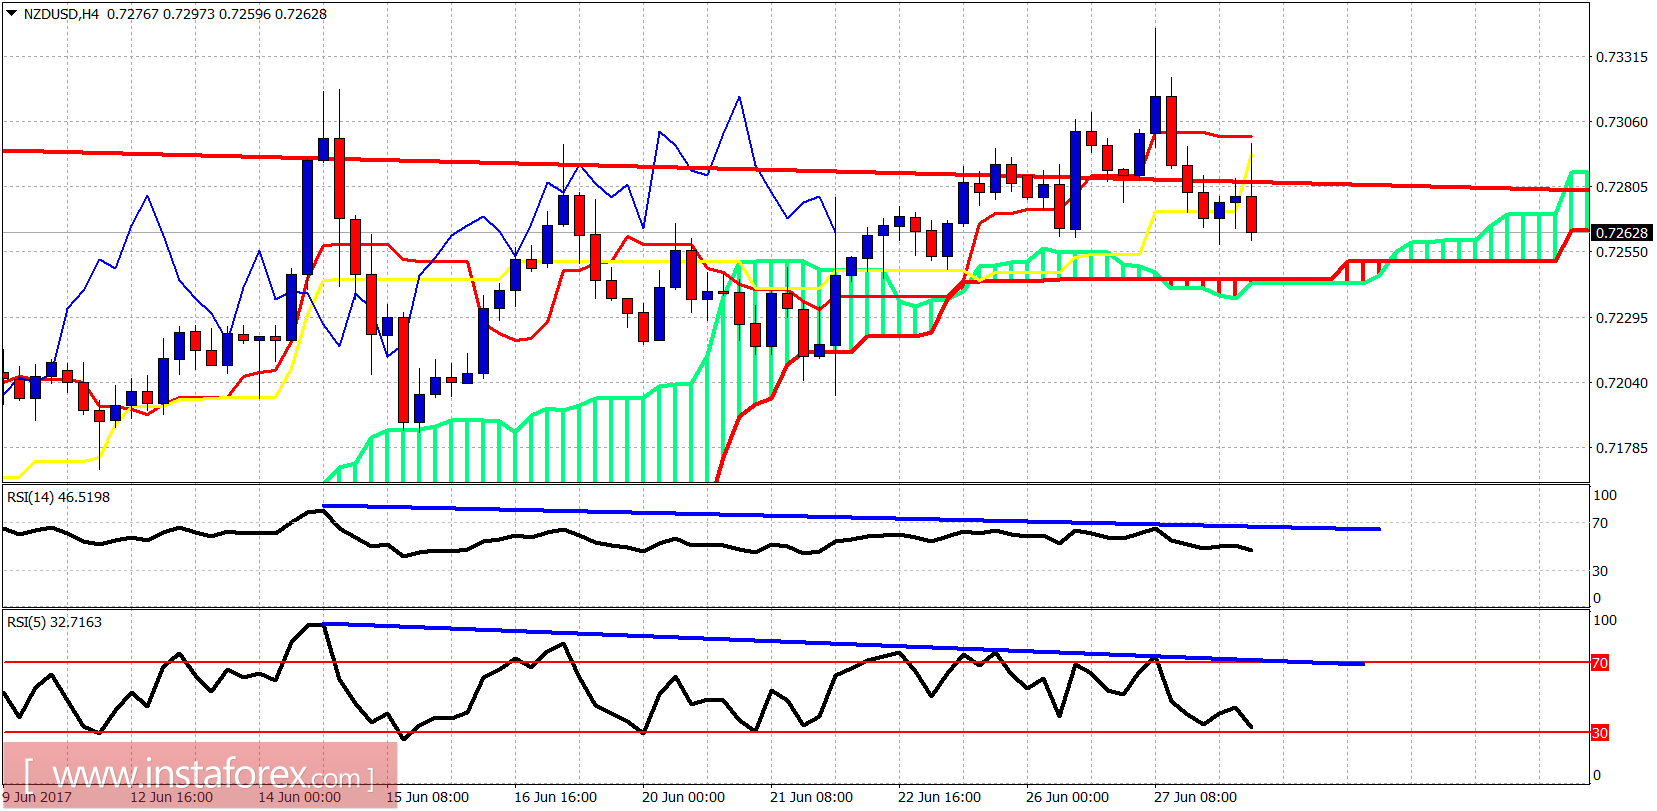
The price action here is very bearish. Technically we have a fake breakout and rejection. Bearish divergence signs. Reversal candle formations.
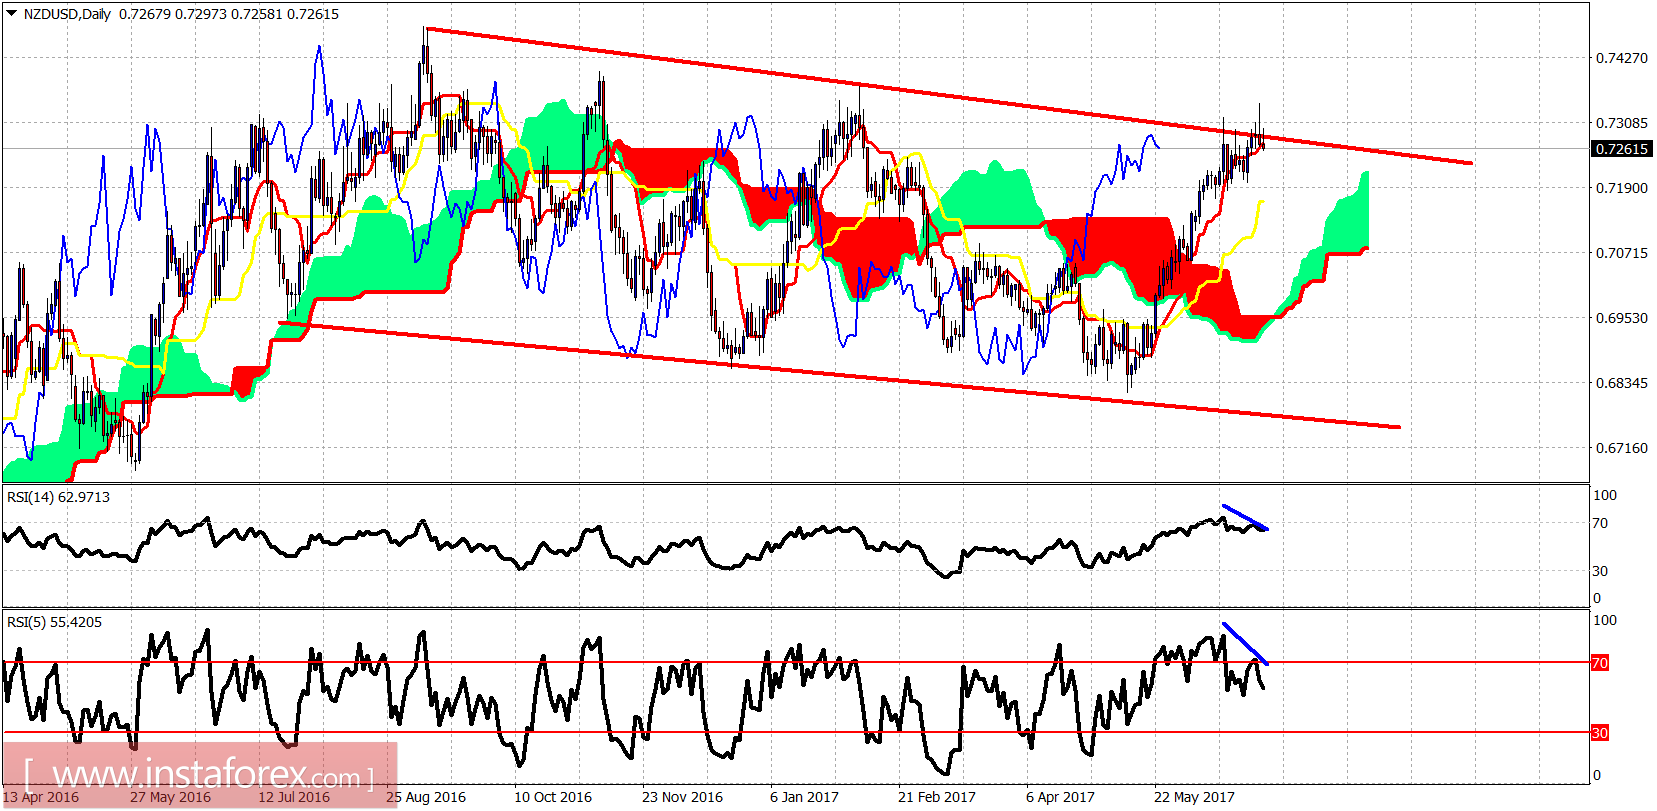
Red lines - bearish channel
The NZDUSD has made a false break out above the upper channel boundary and is turning downwards. I expect a deep pull back for this pair at least towards 0.7165 as the price is already trading below the tenkan-sen.