 English
  Русский
 Bahasa Indonesia
 Bahasa Malay
 ไทย
ไทย Español
 Deutsch
 Български
 Français
 Tiếng Việt
 中文
中文 বাংলা
বাংলা हिन्दी
 Čeština
 Українська
 Română

The focus is now placed in the USDX bearish, as we're seeing a breakout around 95.77, where it should expose the next support placed at the 95.10 level. However, because of this week's decline, the index might start to retrace and it can face the resistance zone of 96.24. A break above it can push USDX to test the 200 SMA at H1 chart.
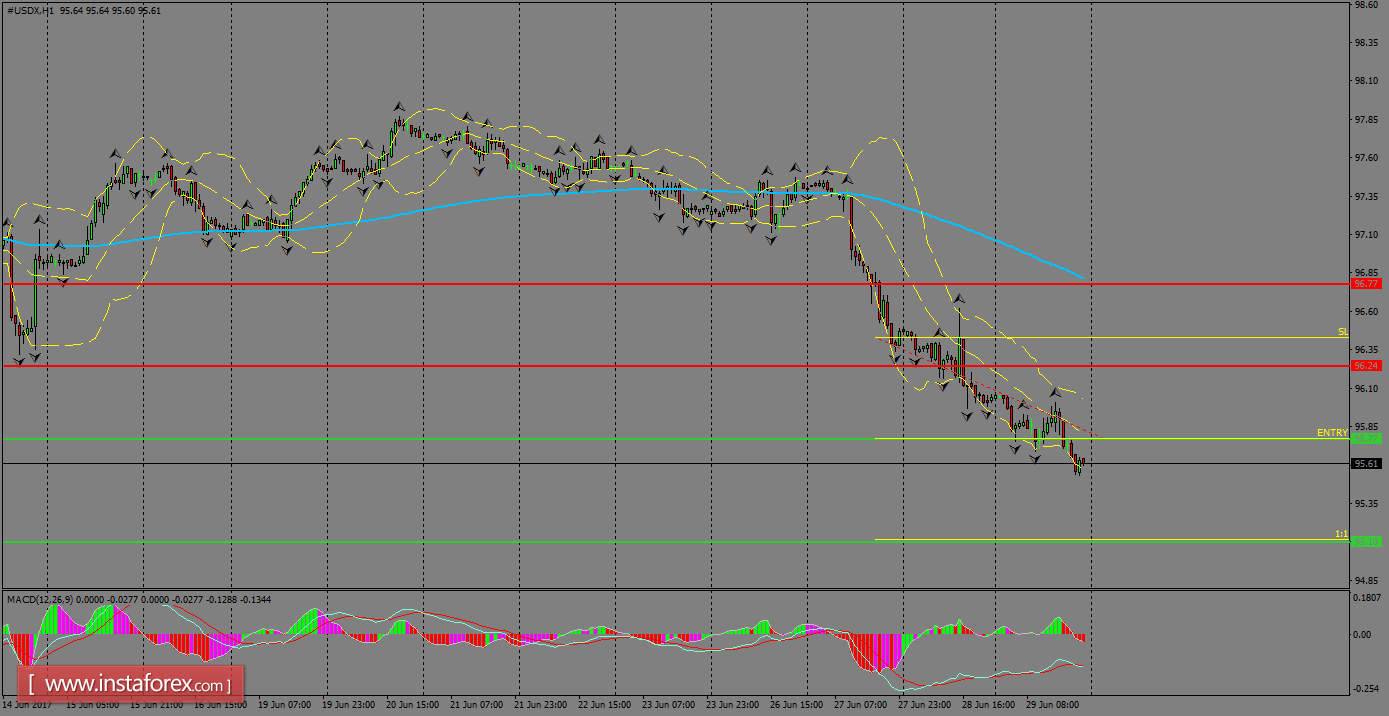
H1 chart's resistance levels: 96.77 / 97.20
H1 chart's support levels: 96.38 / 95.77
Trading recommendations for today: Based on the H1 chart, place sell (short) orders only if the USD Index breaks with a bearish candlestick; the support level is at 95.77, take profit is at 95.10 and stop loss is at 96.42.