 English
  Русский
 Bahasa Indonesia
 Bahasa Malay
 ไทย
ไทย Español
 Deutsch
 Български
 Français
 Tiếng Việt
 中文
中文 বাংলা
বাংলা हिन्दी
 Čeština
 Українська
 Română

USDX ended last week in the red territory and it looks like we can expect some recovery to test the 200 SMA at H1 chart around 96.50. If the index manages to break above the resistance zone of 95.77, then that scenario could be possible. Instead, if we witness a break of last Friday's lows, next interest area for buyers is located around 95.10.
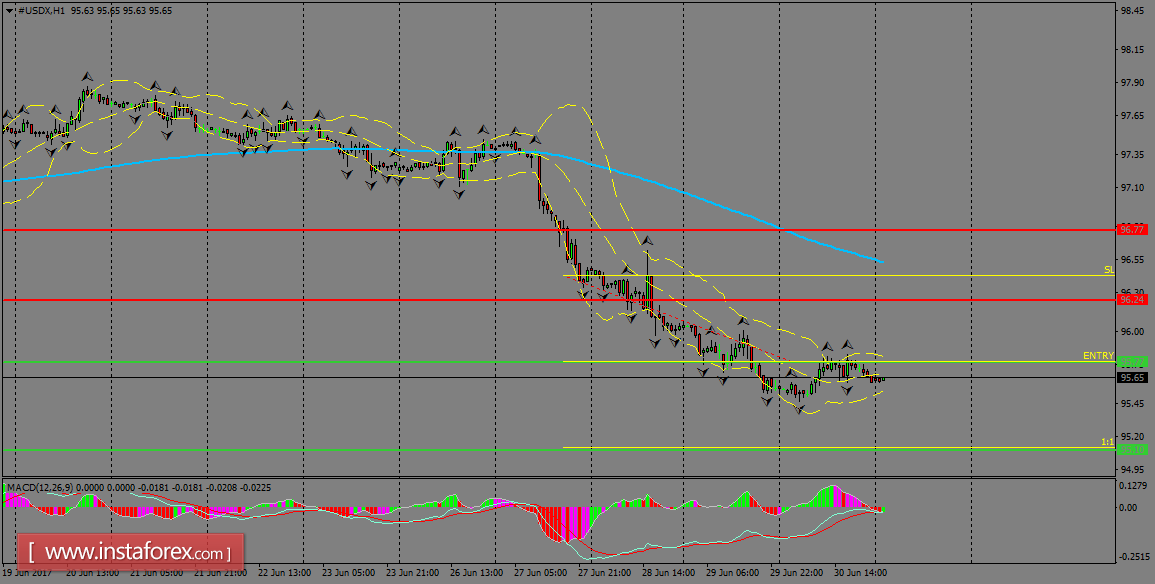
H1 chart's resistance levels: 96.77 / 97.20
H1 chart's support levels: 96.38 / 95.77
Trading recommendations for today: Based on the H1 chart, place sell (short) orders only if the USD Index breaks with a bearish candlestick; the support level is at 95.77, take profit is at 95.10 and stop loss is at 96.42.