 English
  Русский
 Bahasa Indonesia
 Bahasa Malay
 ไทย
ไทย Español
 Deutsch
 Български
 Français
 Tiếng Việt
 中文
中文 বাংলা
বাংলা हिन्दी
 Čeština
 Українська
 Română

The Dollar index is bouncing as expected. The price is now making the minimum bounce requirements towards short-term resistance and previous support at 96.50. Overall I expect a bigger Dollar index bounce towards 98.
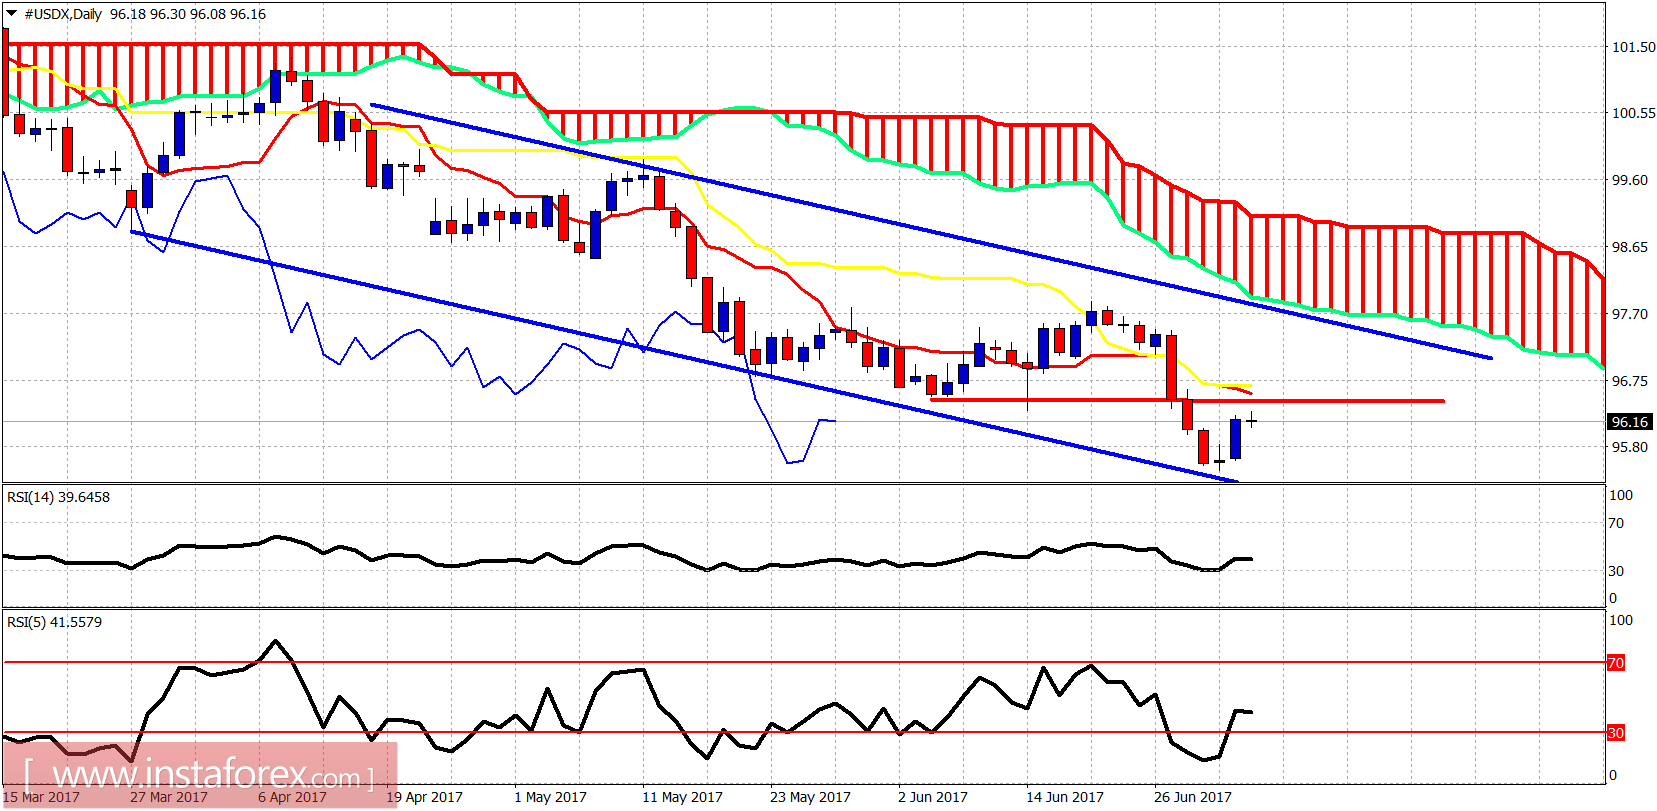
Blue lines - bearish channel
The Dollar Index is testing short-term resistance at 96.50 where we also find the 4-hour tenkan- and kijun-sen indicators. Oscillators bounce off oversold levels. I expect this bounce to continue higher.
Blue lines - bearish channel
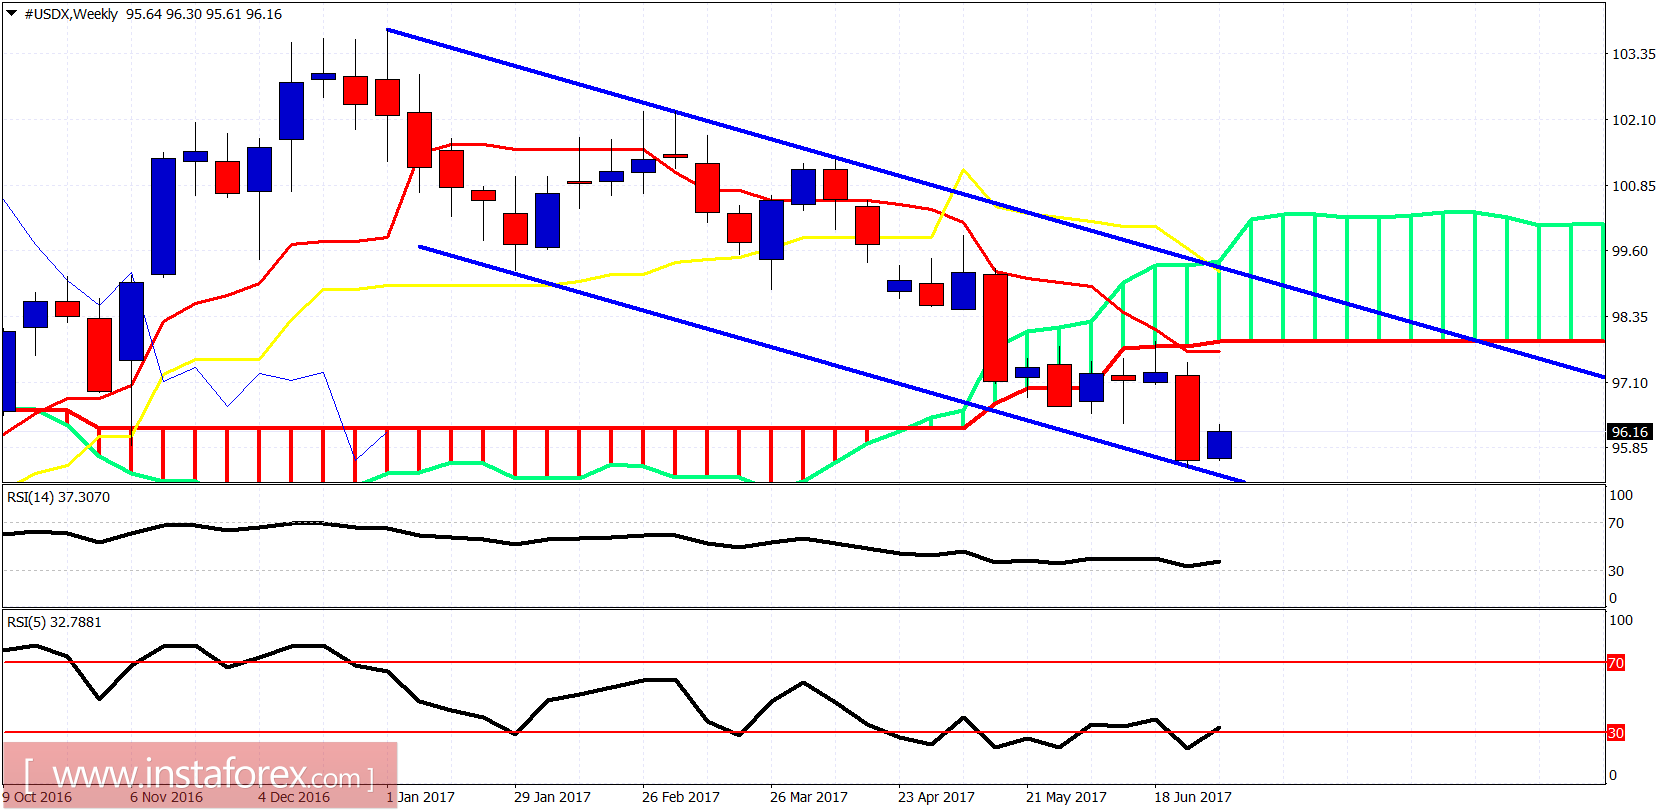
On a weekly basis, although the trend is bearish and the price is below the weekly Kumo (cloud), I expect a short-term bounce for a week or two towards 98-98.50. The RSI is diverging and oversold. I expect at least a move towards the lower Kumo boundary.