 English
  Русский
 Bahasa Indonesia
 Bahasa Malay
 ไทย
ไทย Español
 Deutsch
 Български
 Français
 Tiếng Việt
 中文
中文 বাংলা
বাংলা हिन्दी
 Čeština
 Українська
 Română

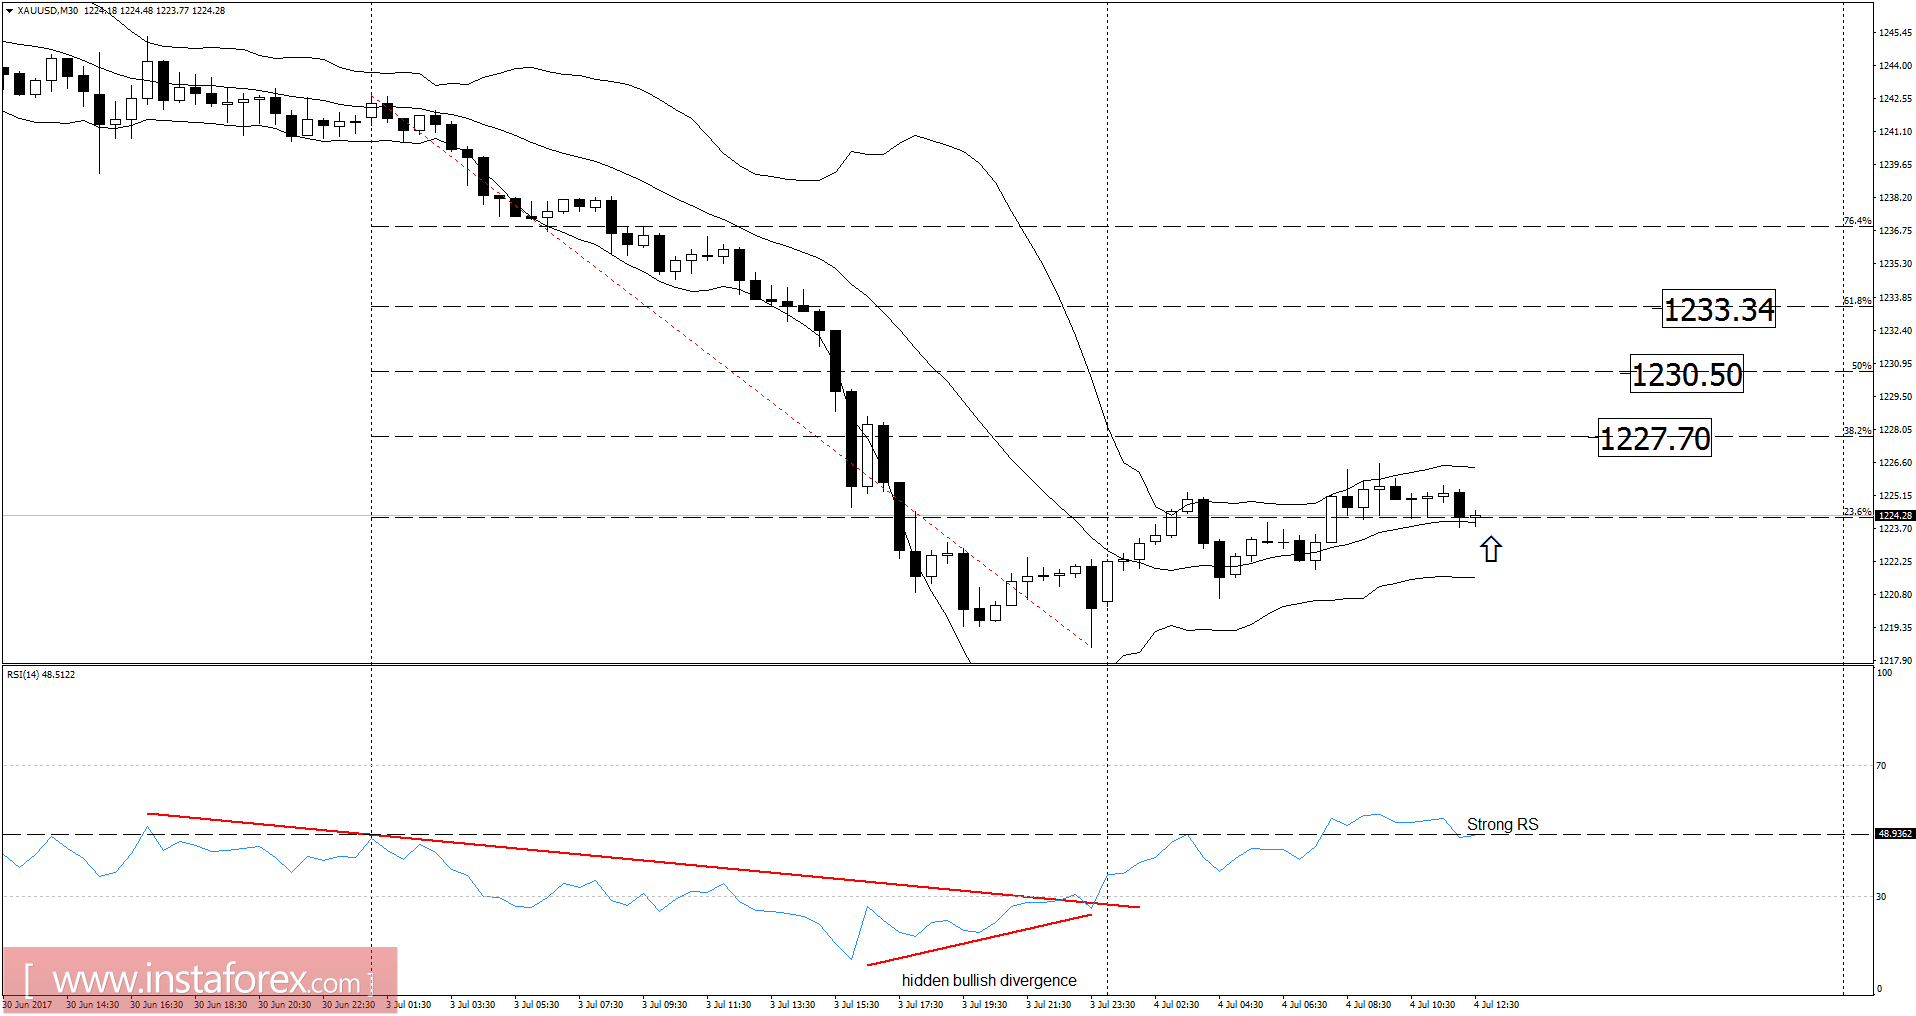
Recently, the Gold has been trading downwards. The price tested the level of $1,218.48. Anyway, according to the 30M time frame, I found potentially hidden buying activity. There is a hidden bullish divergence on the Moving Average Oscillator and there is a strong Relative Strength. My advice is to watch for a potential buying opportunity. I placed Fibonacci retracement to find potential upward targets. I got FR 38.2% at the price of $1,22770, FR 50% at the price of $1,230.50 and FR 61.8% at the price of $1,233.00.
Resistance levels:
R1: $1,238.20
R2: $1,252.00
R3: $1,262.00
Support levels:
S1: $1,214.00
S2: $1,205.00
S3: $1,191.20
Trading recommendations for today: watch for potential buying opportunities.