 English
  Русский
 Bahasa Indonesia
 Bahasa Malay
 ไทย
ไทย Español
 Deutsch
 Български
 Français
 Tiếng Việt
 中文
中文 বাংলা
বাংলা हिन्दी
 Čeština
 Українська
 Română

Gold price remains in a bearish short-term trend. There are some signs of a possible bounce in the short term but Gold price will need to break above $1,250 to change short-term trend to bullish.
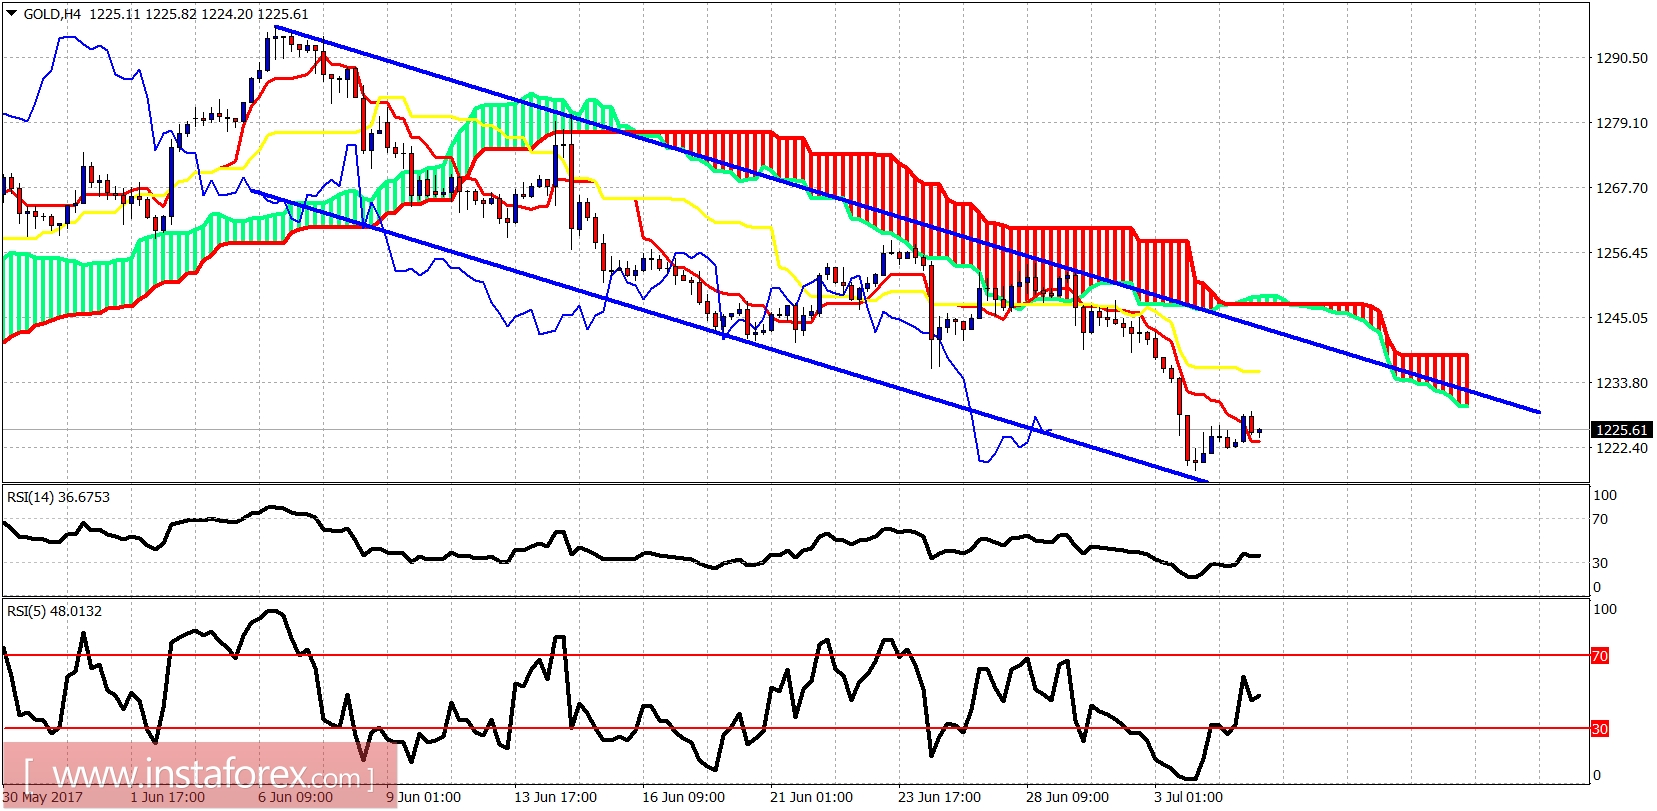
Gold price continues to trade below the 4-hour Kumo and the kijun-sen. Price is trying to break above the tenkan-sen. This is the first reversal signal. The RSI is turning upwards and this is another sign of reversal. Price being so close to the lower channel boundary implies it is supported. I expect at least a bounce towards the upper channel boundary where we also find a thin cloud. Thin cloud areas are usually tested and broken.
Blue line -long-term support
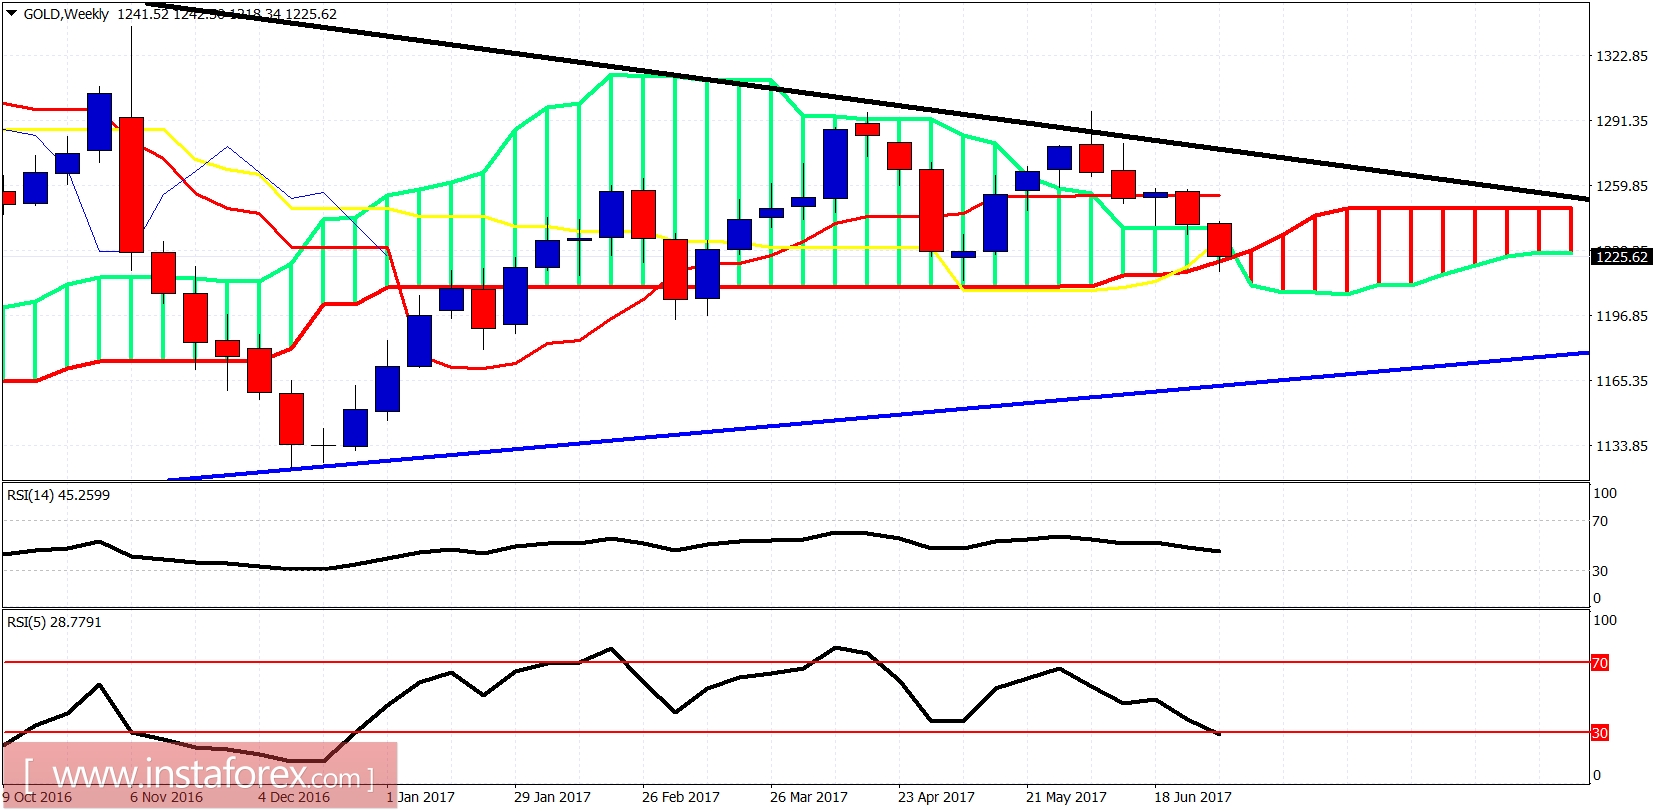
Weekly candle is testing the weekly Kumo support. The RSI indicators could move a bit lower which implies that we could even see a move towards $1,170-80 before the bigger upward move. Overall I remain longer-term bullish.