English
  Русский
 Bahasa Indonesia
 Bahasa Malay
 ไทย
ไทย Español
 Deutsch
 Български
 Français
 Tiếng Việt
 中文
中文 বাংলা
বাংলা हिन्दी
 Čeština
 Українська
 Română

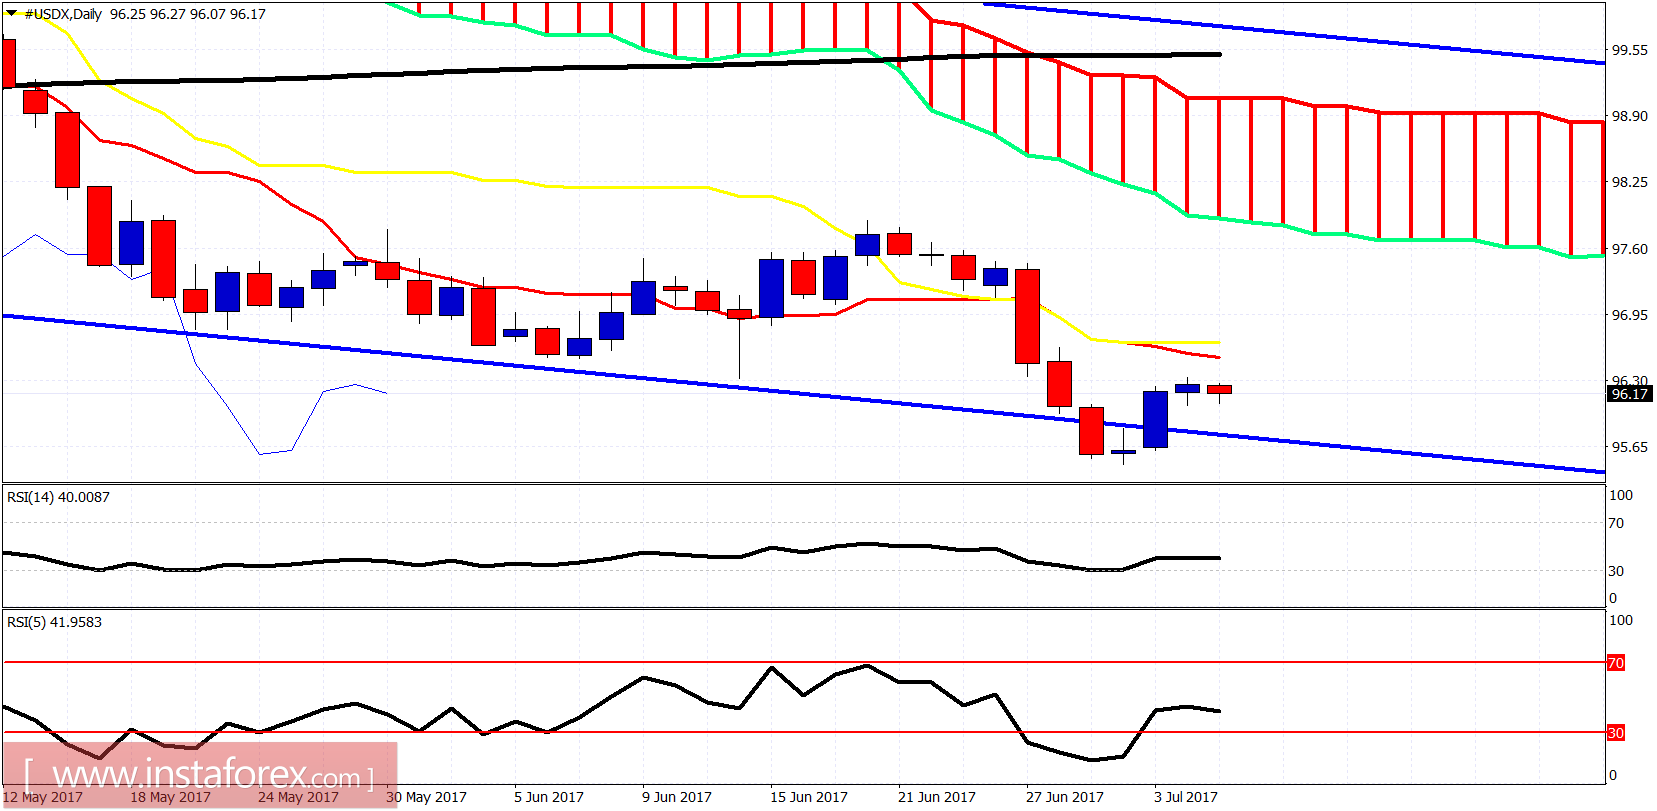
The Dollar index bounced as expected but found resistance at 96.50 and did not manage to break it. A rejection at current levels will imply a move lower below 95.
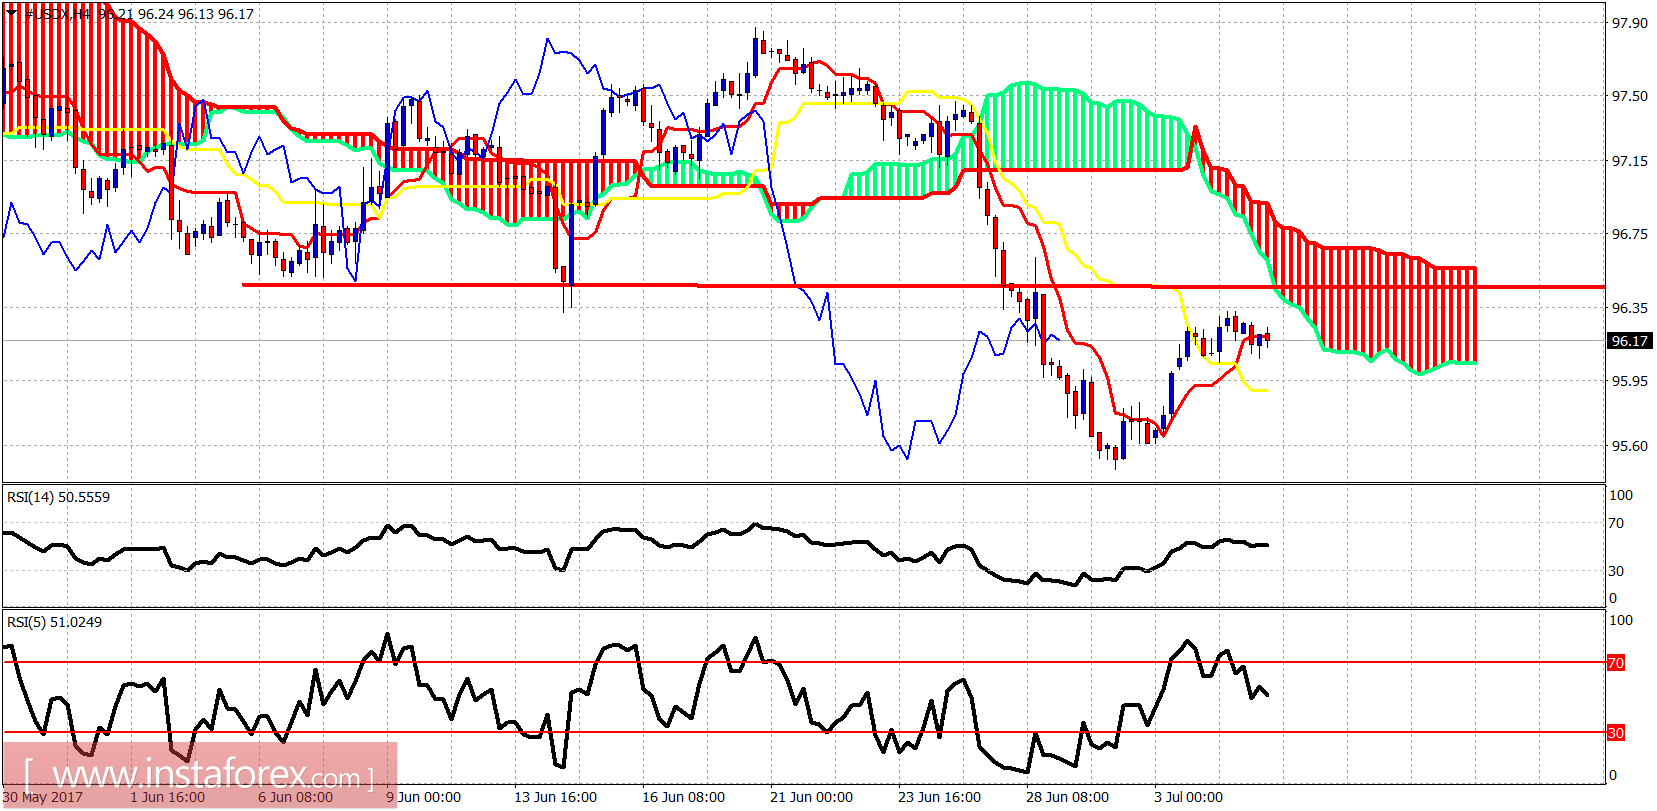
Price is below the 4-hour Kumo and trying to hold above the tenkan- and kijun-sen indicators. Support is at 96 and resistance at 96.50. A break above 96.50 could push the index towards 98. A break below 96 will open the way for new lows towards 94.50.