 English
  Русский
 Bahasa Indonesia
 Bahasa Malay
 ไทย
ไทย Español
 Deutsch
 Български
 Français
 Tiếng Việt
 中文
中文 বাংলা
বাংলা हिन्दी
 Čeština
 Українська
 Română

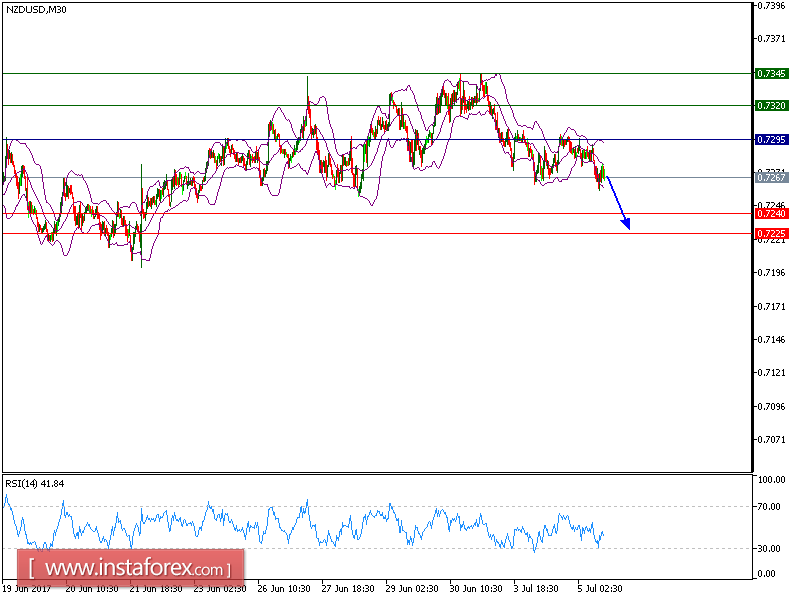
NZD/USD is expected to trade with a bearish outlook. Although the pair posted a rebound and broke above the 50-period moving average, it is still trading below the key resistance at 0.7305, which should limit the upside potential. The relative strength index is mixed with a bearish bias.
Therefore, as long as 0.7295 is not surpassed, look for a further decline to 0.7240 and even to 0.7225 in extension.
Strategy: SELL Stop Loss: 0.7295. Take Profit: 0.7240
Chart Explanation: The black line shows the pivot point. Currently, the price is above the pivot point which indicates the bullish position. If it is below the pivot points, it indicates the short position. The red lines show the support levels and the green line indicates the resistance levels. These levels can be used to enter and exit trades.
Resistance levels: 0.7320, 0.7345, and 0.7370
Support levels: 0.7240, 0.7225, and 0.7200