 English
  Русский
 Bahasa Indonesia
 Bahasa Malay
 ไทย
ไทย Español
 Deutsch
 Български
 Français
 Tiếng Việt
 中文
中文 বাংলা
বাংলা हिन्दी
 Čeština
 Українська
 Română

USDX was under pressure during Thursday's session after it found dynamic resistance around the 200 SMA at H1 chart. Now, the index could attempt a breakout below 95.77, which could also increase the downside acceleration towards 95.10 in a first degree. MACD indicator is still in the negative territory, supporting the current scenario.
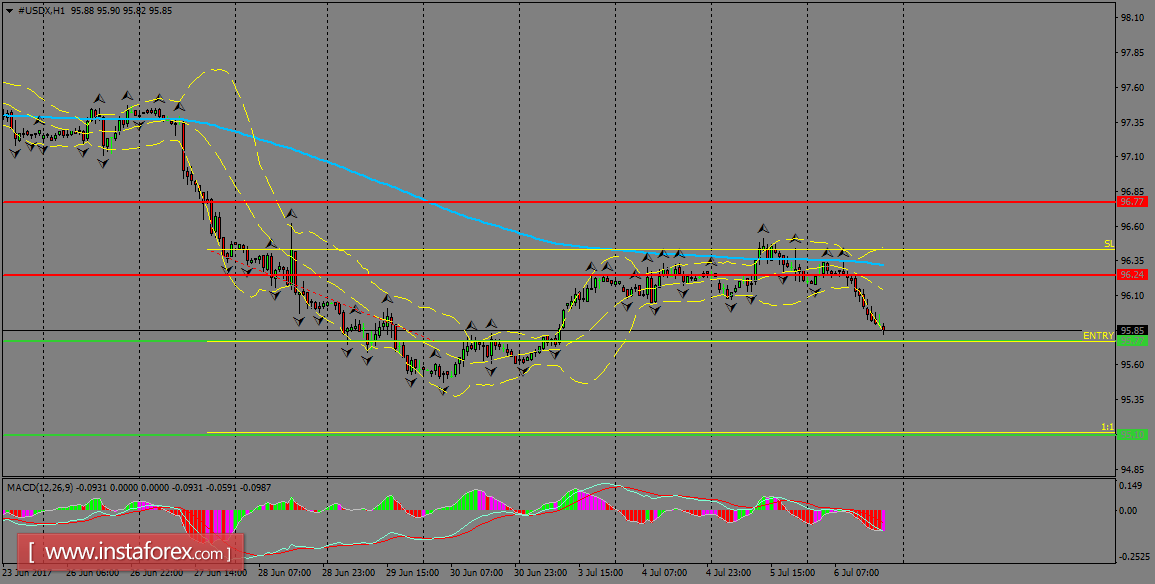
H1 chart's resistance levels: 96.77 / 97.20
H1 chart's support levels: 96.38 / 95.77
Trading recommendations for today: Based on the H1 chart, place sell (short) orders only if the USD Index breaks with a bearish candlestick; the support level is at 95.77, take profit is at 95.10 and stop loss is at 96.42.