 English
  Русский
 Bahasa Indonesia
 Bahasa Malay
 ไทย
ไทย Español
 Deutsch
 Български
 Français
 Tiếng Việt
 中文
中文 বাংলা
বাংলা हिन्दी
 Čeština
 Українська
 Română

GBP/USD saw a strong decline from the resistance zone of 1.3106 and it looks like the pair could resume the bullish bias, as the 200 SMA at the H1 chart is very close to the current price. If that happens, it needs to break above 1.3106 in order to reach the 1.3238 level. MACD indicator is turning oversold, calling for that rebound to happen.
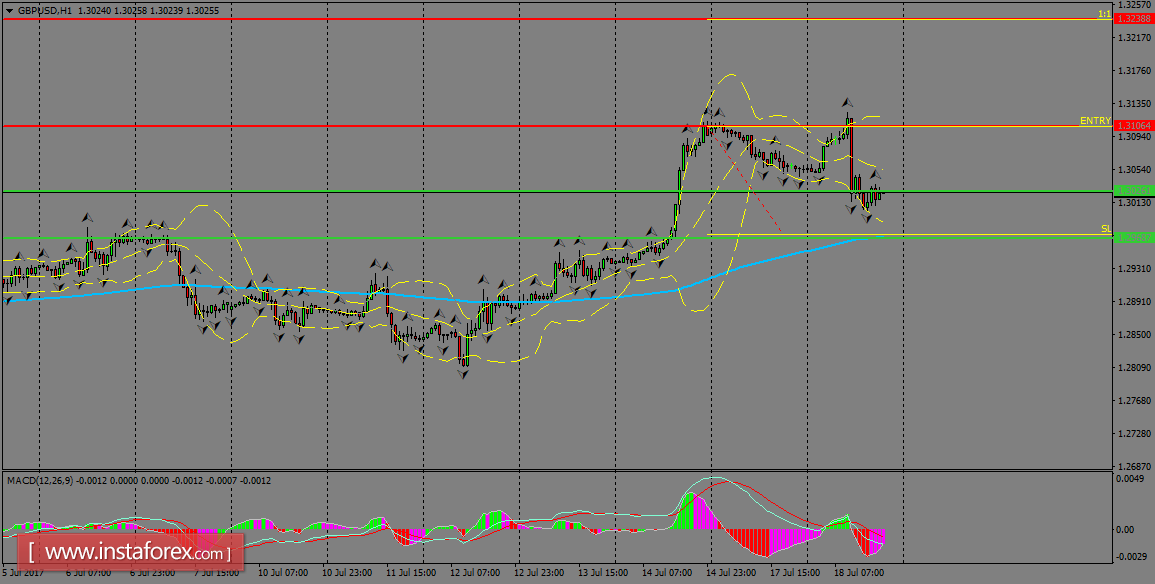
H1 chart's resistance levels: 1.3106 / 1.3238
H1 chart's support levels: 1.3026 / 1.2968
Trading recommendations for today: Based on the H1 chart, buy (long) orders only if the GBP/USD pair breaks a bullish candlestick; the resistance level is at 1.3106, take profit is at 1.3238 and stop loss is at 1.2971.