 English
  Русский
 Bahasa Indonesia
 Bahasa Malay
 ไทย
ไทย Español
 Deutsch
 Български
 Français
 Tiếng Việt
 中文
中文 বাংলা
বাংলা हिन्दी
 Čeština
 Українська
 Română

USDX extended the decline during Monday's session on Healthcare headlines that two Republicans rejected to vote for it. Currently, the index could be targeting the support zone of 94.16, where a break below that level should help to accelerate the downside towards 93.29. MACD indicator is turning neutral and we can expect some consolidation moves to happen.
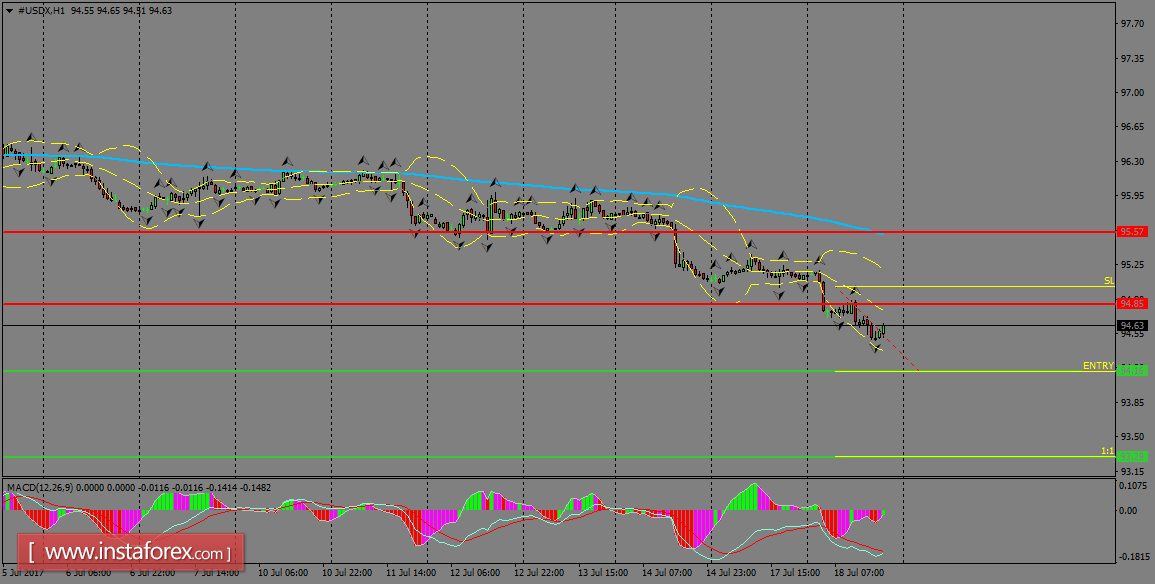
H1 chart's resistance levels: 94.85 / 95.57
H1 chart's support levels: 94.16 / 93.29
Trading recommendations for today: Based on the H1 chart, place sell (short) orders only if the USD Index breaks with a bearish candlestick; the support level is at 94.16, take profit is at 93.29 and stop loss is at 95.02.