 English
  Русский
 Bahasa Indonesia
 Bahasa Malay
 ไทย
ไทย Español
 Deutsch
 Български
 Français
 Tiếng Việt
 中文
中文 বাংলা
বাংলা हिन्दी
 Čeština
 Українська
 Română

The Dollar index reached our target of 94.70 and is bouncing. Is this the end of the decline? Is the Dollar index going to make a strong bounce?Technically it has all the necessary conditions to do so but trend remains bearish. There is no reversal sign yet.
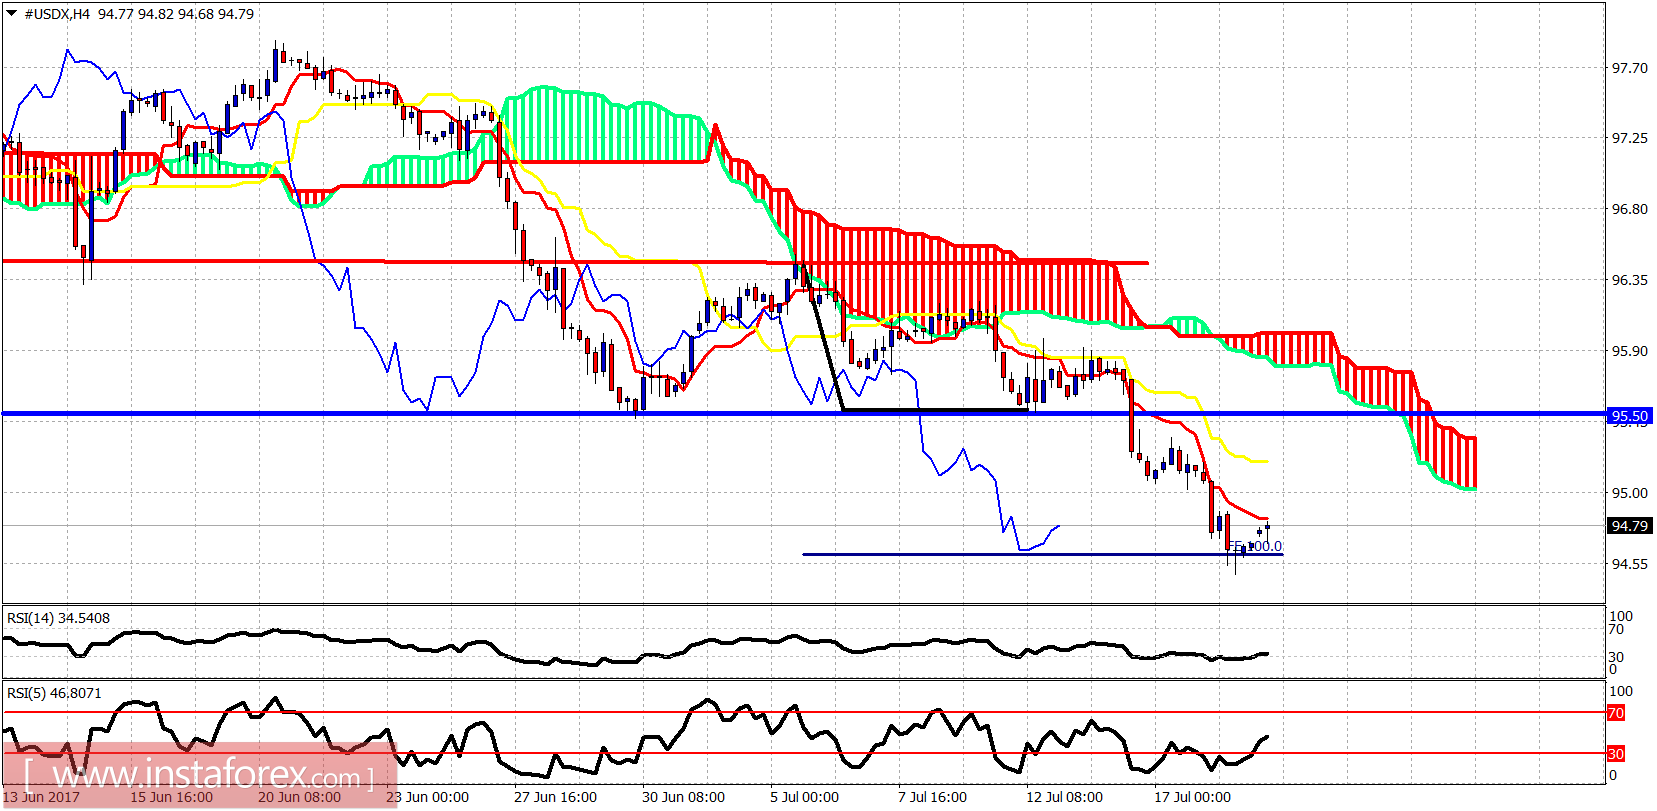
Blue line -support (broken) resistance now
The Dollar index reached the 100% extension of the rejection to lows move. Price is below both the tenkan- and kijun-sen making lower lows and lower highs. Trend remains bearish. Support is at 94.70 and next at 94.05. Resistance is at 94.90 and next at 95.25.
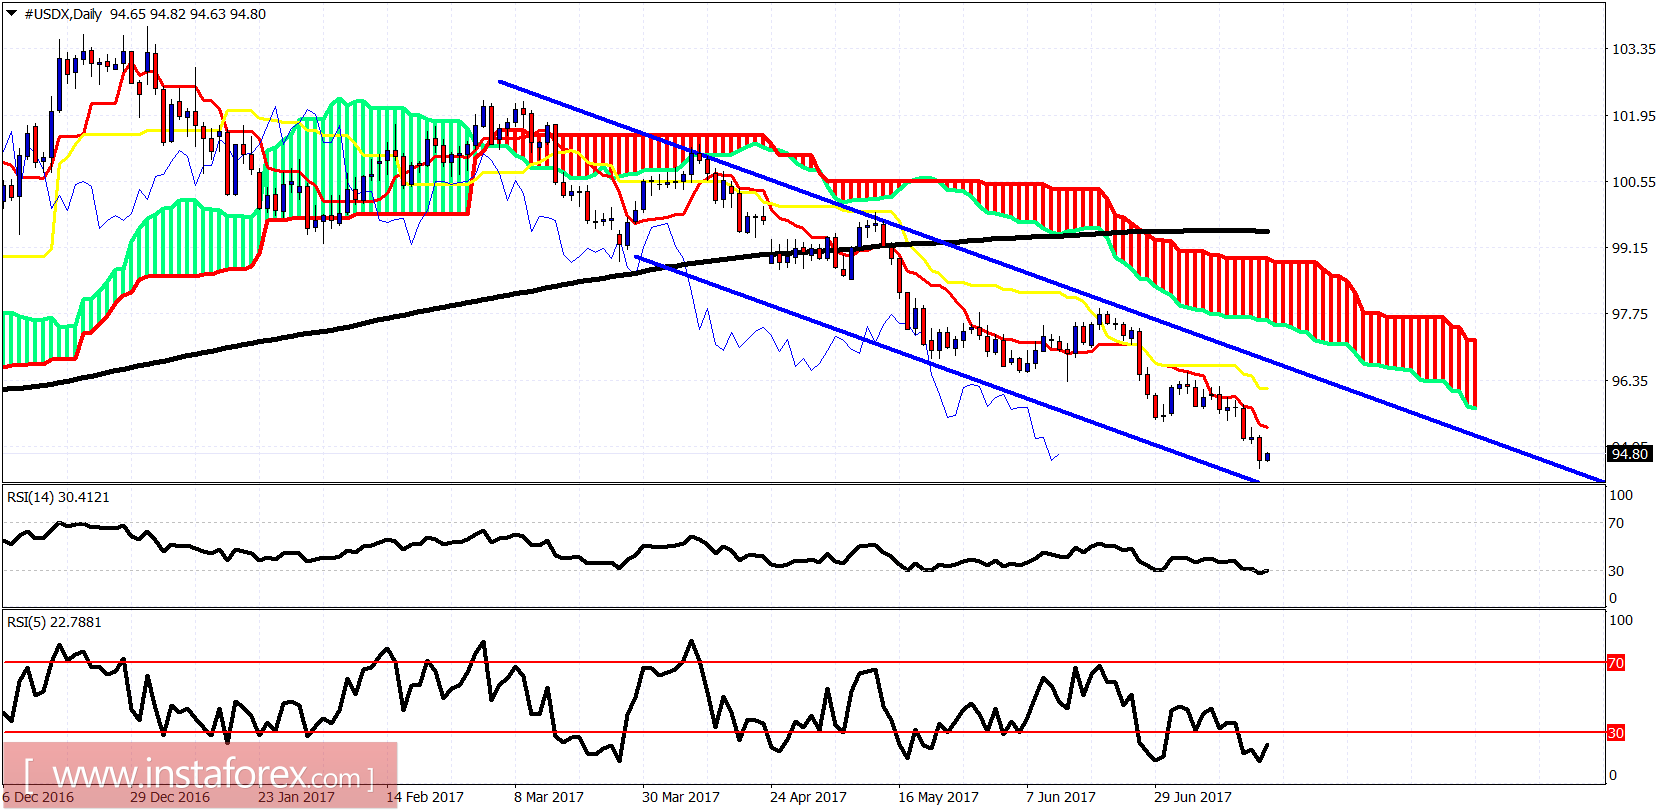
On a daily basis, price is inside the bearish channel and below both the tenkan- and kijun-sen indicators. Trend is clearly bearish. The oscillators are in oversold territory and a bounce towards 97 is justified if not higher. Daily resistance is at 95.40-96.15. Breaking above these two levels could change short-term trend to bullish and push price towards 97-98.