 English
  Русский
 Bahasa Indonesia
 Bahasa Malay
 ไทย
ไทย Español
 Deutsch
 Български
 Français
 Tiếng Việt
 中文
中文 বাংলা
বাংলা हिन्दी
 Čeština
 Українська
 Română

The Dollar index is bouncing off the 94.50 area towards 95 where we find the previous lows and the kijun-sen indicator as resistance. Trend remains bearish as long as price is below 95.80.
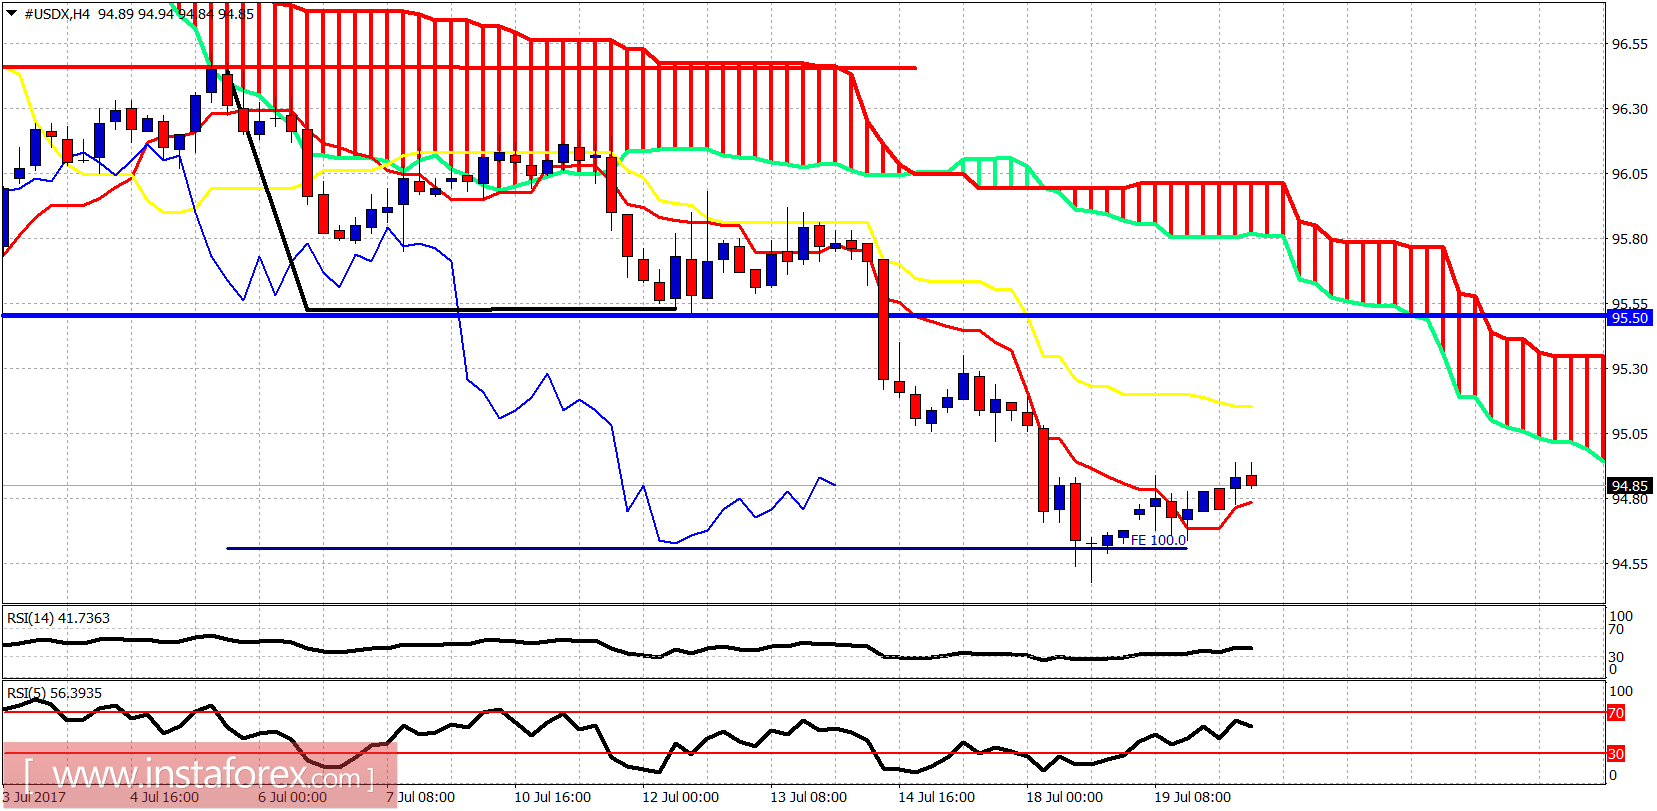
Red line - resistance
Blue line - resistance (former broken support)
The Dollar index is in a bearish trend. Price is above the tenkan-sen (Red line indicator) and this implies we could see price move towards the kijun-sen (yellow line indicator) at 95.15. Cloud resistance is at 95.50-95.80. Price continues to make lower lows and lower highs. No trend reversal signal yet.
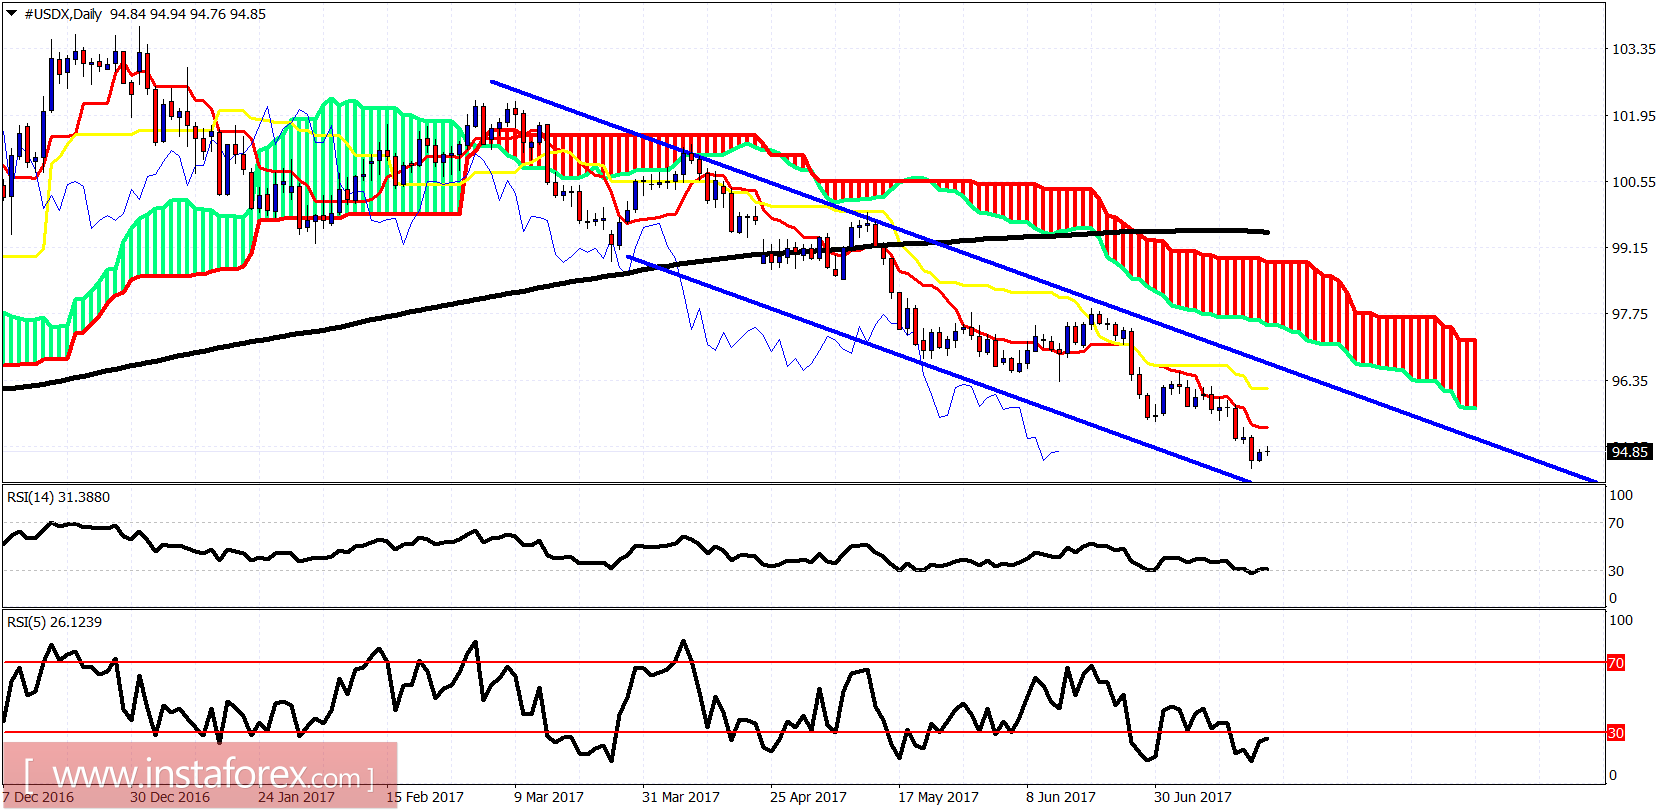
The Dollar index remains inside the bearish channel and below both the tenkan- and kijun-sen indicators. Price is also below the 200 Day MA. Daily resistance is at 95.50-96.20 area. As long as we trade below these levels, we are in a bearish daily trend looking for a move towards 92.