 English
  Русский
 Bahasa Indonesia
 Bahasa Malay
 ไทย
ไทย Español
 Deutsch
 Български
 Français
 Tiếng Việt
 中文
中文 বাংলা
বাংলা हिन्दी
 Čeština
 Українська
 Română

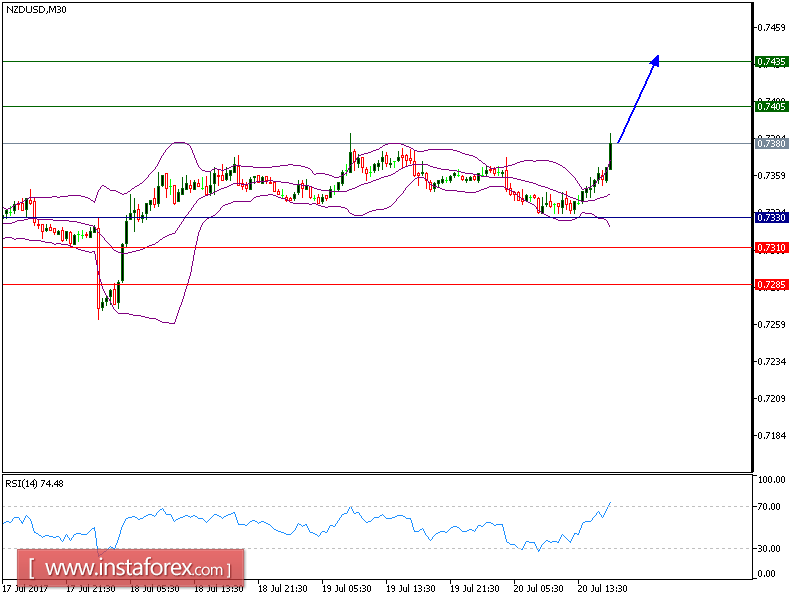
Our target which we predicted in 18th July analysis has been hit. NZD/USD is expected to continue its upside movement. Although the pair posted a pullback, it is still trading above the key support at 0.7330, which should limit the downside potential. The relative strength index calls for a new upleg.
Hence, as long as 0.7330 is not broken, look for a further rise to 0.7405 and even to 0.7435 in extension.
Strategy: BUY Stop Loss: 0.7330 Take Profit: 0.7405
Chart Explanation:
The black line shows the pivot point. Currently, the price is above the pivot point which indicates the bullish position. If it is below the pivot points, it indicates the short position. The red lines show the support levels and the green line indicates the resistance levels. These levels can be used to enter and exit trades.
Resistance levels: 0.740, 0.7405, and 0.7445
Support levels: 0.7310, 0.7285, and 0.7245