English
  Русский
 Bahasa Indonesia
 Bahasa Malay
 ไทย
ไทย Español
 Deutsch
 Български
 Français
 Tiếng Việt
 中文
中文 বাংলা
বাংলা हिन्दी
 Čeština
 Українська
 Română

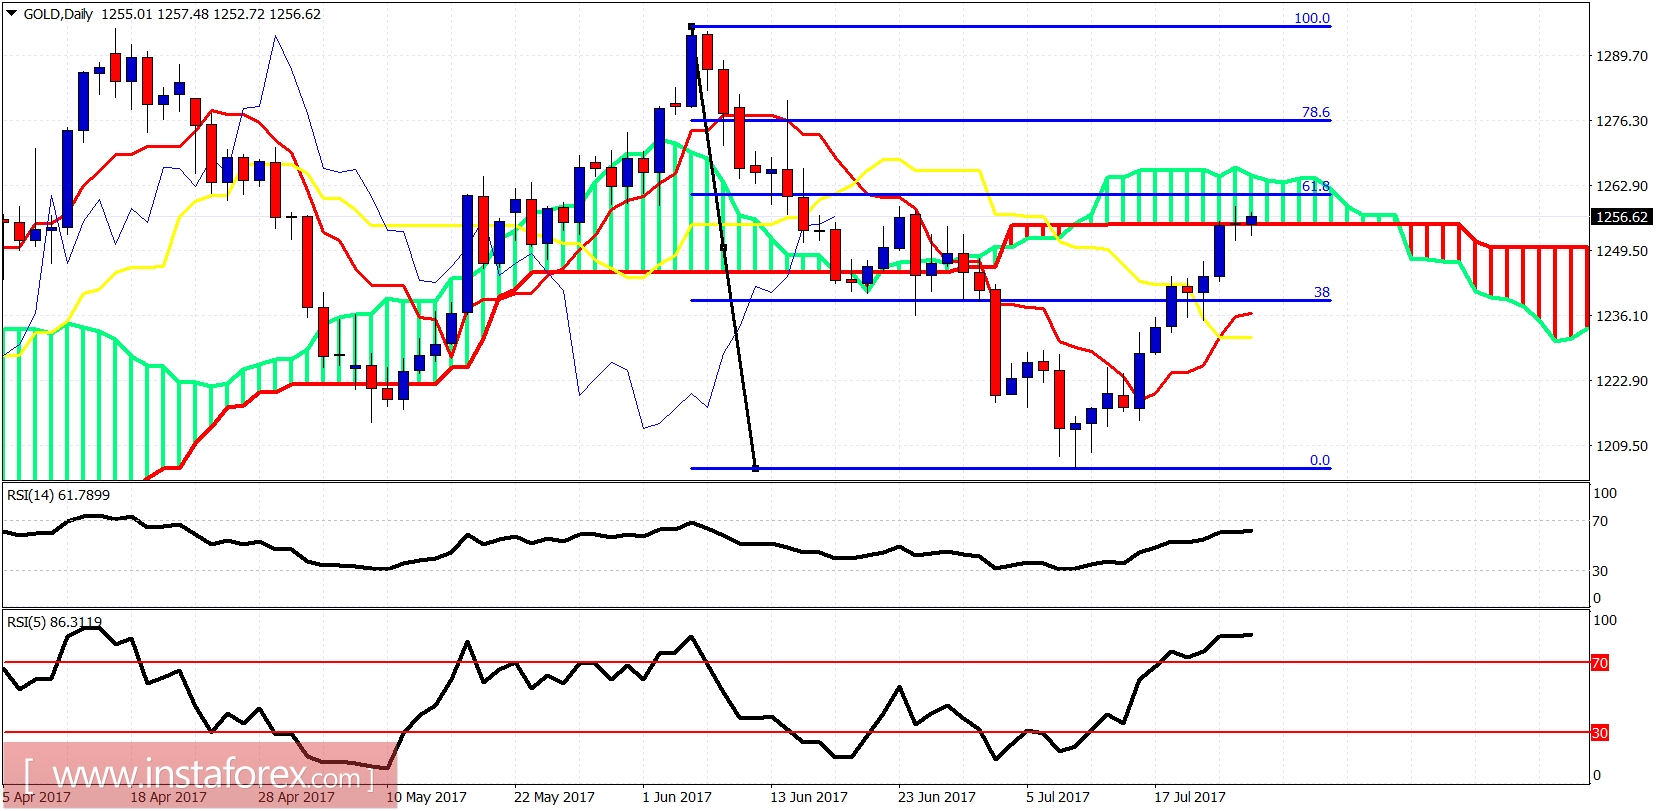
The Gold price is consolidating near its highs. It is very possible that we might see a move above $1,260 soon for a final new high of this move that started at $1,205. Gold bulls must be very cautious as a pull back is justified from current levels.
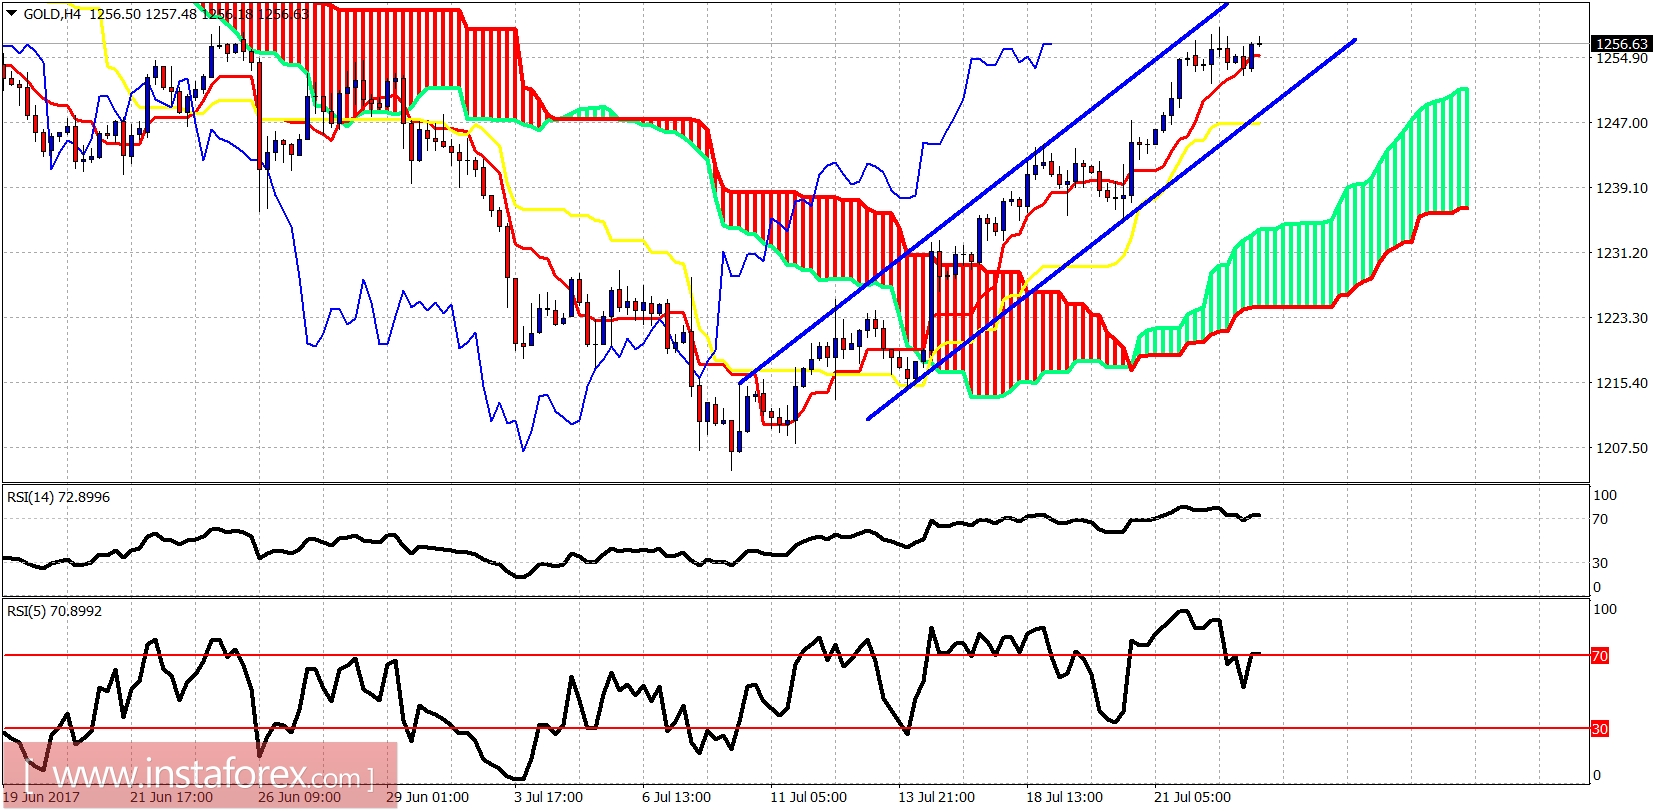
The Gold price is inside the bullish channel and above both the tenkan- and kijun-sen in the 4-hour chart as shown above. The trend is clearly bullish as the price is making higher highs and higher lows. There is no trend reversal signal, only warnings that this short-term trend might end soon. Support is at $1,247. Resistance is at $1,264.