 English
  Русский
 Bahasa Indonesia
 Bahasa Malay
 ไทย
ไทย Español
 Deutsch
 Български
 Français
 Tiếng Việt
 中文
中文 বাংলা
বাংলা हिन्दी
 Čeština
 Українська
 Română

The Dollar index remains in a bearish trend. No reversal signal yet, although we have some warning signs as oscillators get oversold. The key support area for the long-term is at 92-93.
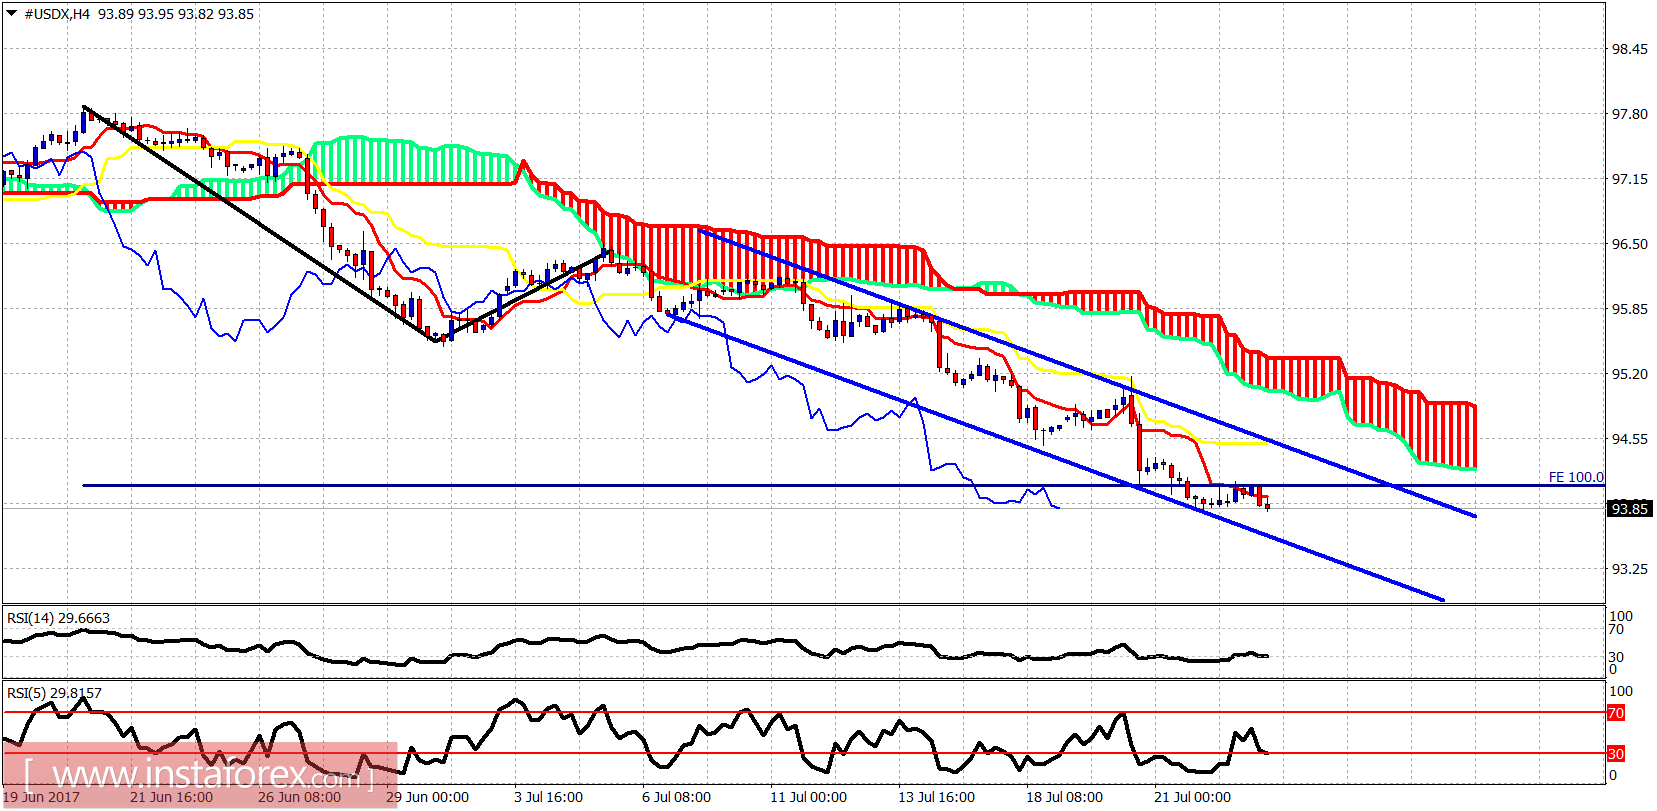
The Dollar index is clearly in a bearish trend making lower lows and lower highs. Price remains inside the bearish channel and below both the tenkan- and kijun-sen indicators on the 4-hour chart. Short-term support is at 93.50 and resistance is at 94.50.
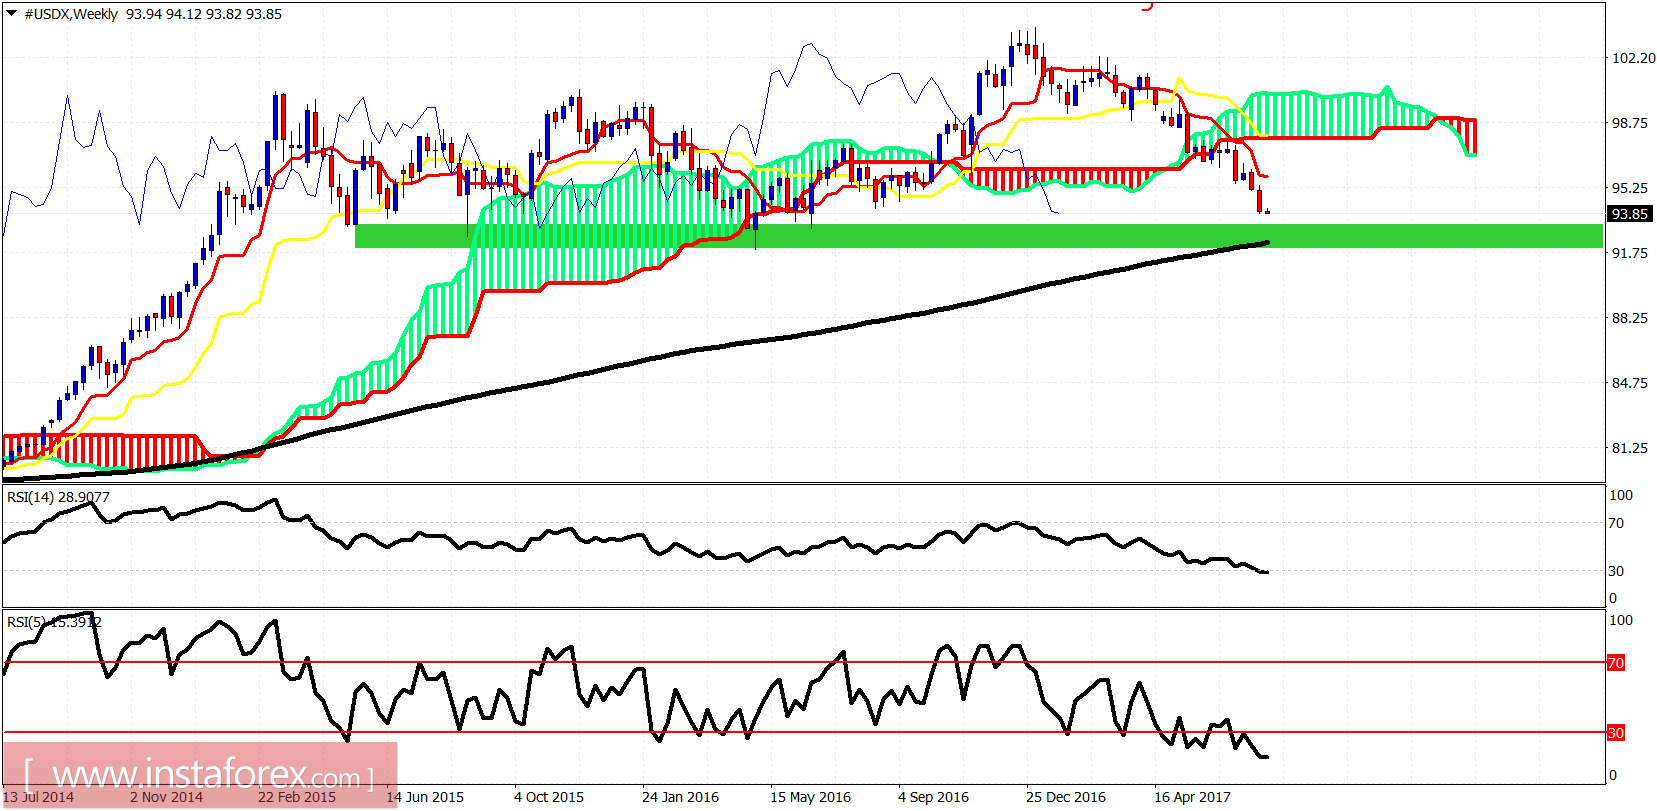
The Dollar index has broken below the weekly Kumo (cloud) and is heading towards the green rectangle support area where it could also find support at the 200 MA currently at 92.35. Oscillators are oversold. It is just a warning to be cautious.