 English
  Русский
 Bahasa Indonesia
 Bahasa Malay
 ไทย
ไทย Español
 Deutsch
 Български
 Français
 Tiếng Việt
 中文
中文 বাংলা
বাংলা हिन्दी
 Čeština
 Українська
 Română

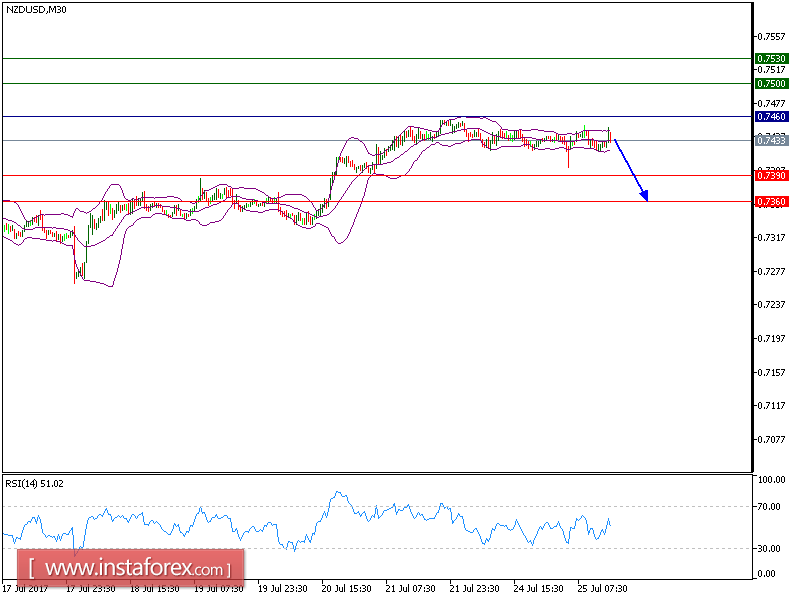
NZD/USD is expected to trade with a bearish outlook. The pair is capped by a bearish trend line since 21 July, which confirms a negative outlook. The relative strength index is also capped by a declining trend line since 20 July. The upside potential should be limited by the key resistance at 0.7460 (the high of July 21).
Therefore, as long as this key level is not surpassed, expect a return to 0.7390 and 0.7360 in extension.
Strategy: SELL Stop Loss: 0.7460 Take Profit: 0.7390
Chart Explanation:
The black line shows the pivot point. Currently, the price is above the pivot point which indicates the bullish position. If it is below the pivot points, it indicates the short position. The red lines show the support levels and the green line indicates the resistance levels. These levels can be used to enter and exit trades.
Resistance levels: 0.750, 0.7530, and 0.7565
Support levels: 0.7390, 0.7360, and 0.7330